
Results of the 18th Graph Drawing Contest
This page reports on the results of the 18th Graph Drawing Contest, held in conjunction with the 2011 Graph Drawing Symposium in Eindhoven, the Netherlands.
Overall, we received 30 submissions: 12 submissions for the offline contest and 18 submissions in the online challenge.
Angular Resolution
For the two categories in this topic, our primary concern was angular resolution. The angular resolution of any vertex in a drawing is the smallest angle formed by its adjacent edges. When the edges are drawn as curved arcs it is measured with regards to the tangent at that vertex. In addition, we required that the graph should use a reasonably small grid area. The vertices did not have to be on an integer grid but the vertex resolution, the ratio between the distance of the closest two vertices and the farthest two vertices, should still remain relatively low. Both contest graphs were highly symmetric so any exploitation of that feature was also taken into consideration.
Category A: Straight-line Planar
The first data set for the angular resolution topic was a planar graph with 48 nodes and 102 edges, and contestants had to create a drawing of the graph in the plane, without crossings, and using only straight-line edges. Whereas many bad examples of angular resolution use sequences of nested triangles, this graph contained only two nested triangles whose removal created a collection of outerplanar graphs.
We received only one valid submission in this category, and hence the winner was Hanley Weng from the University of Sydney. The layout was created by starting with a drawing produced by a variation of the spring-embedder algorithm, which was then manually modified such that the recursive symmetric structure of the graph was emphasized.
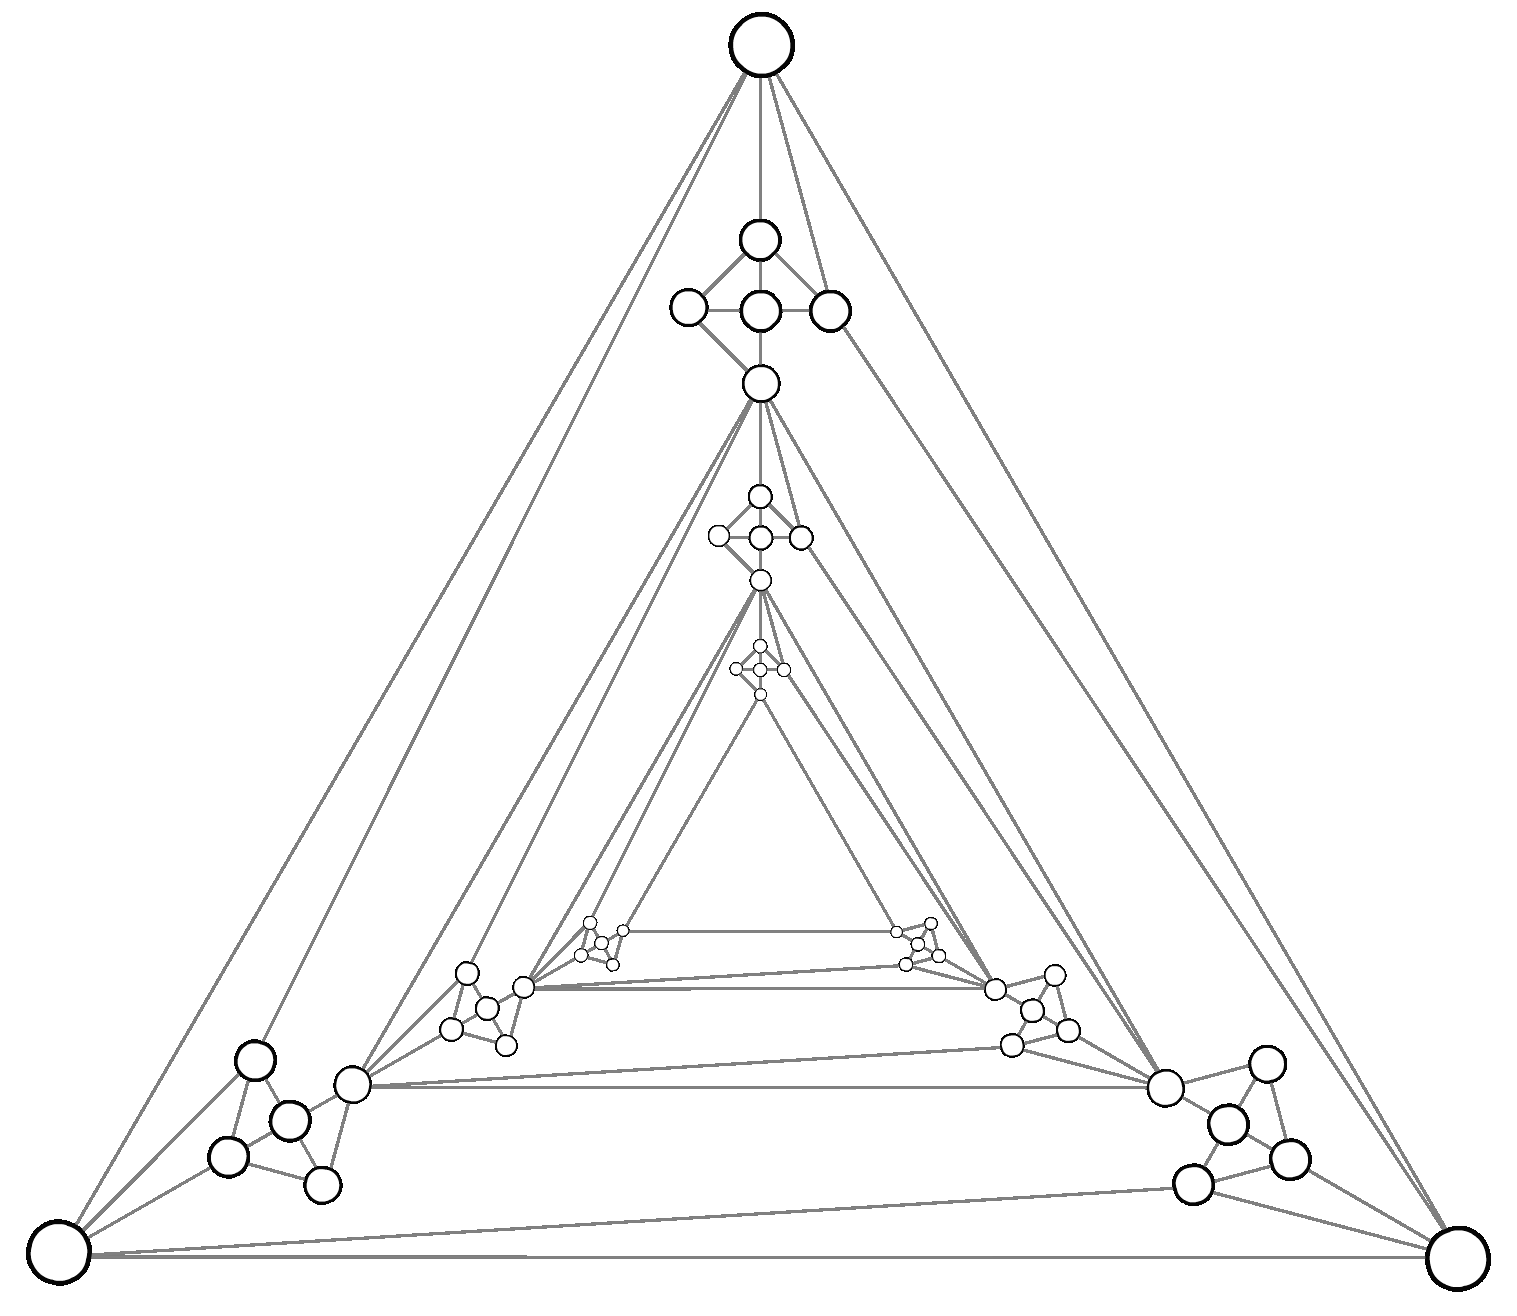
First place: Angular Resolution, Category A (click to enlarge)
Category B: Curved Drawings
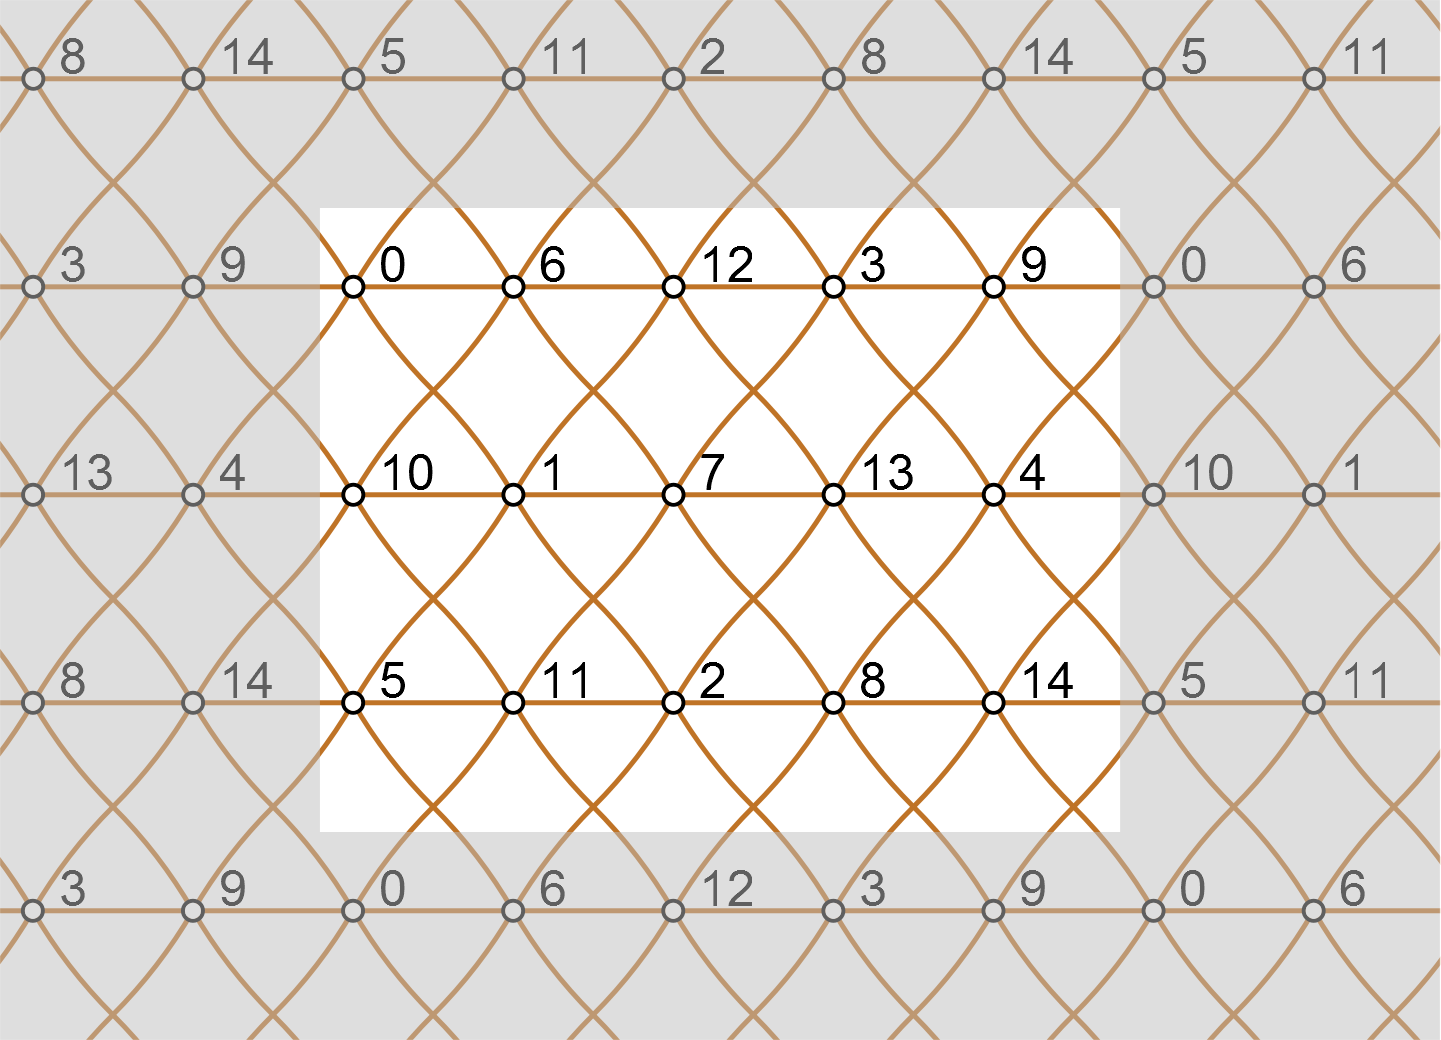
The second graph had 15 nodes and 45 edges and was not planar. The drawing, again in the plane, could have as many crossings as necessary but the angles of the crossings were also taken into consideration. In addition, the drawings could use curved arcs. There could be as many bends as needed but during judging both the number of bends and smoothness of the bends were taken into consideration and weighed against the gain in overall angular resolution.
We received 5 submissions (8 drawings), from which two submissions with poly-arc Lombardi drawings and perfect angular resolution looked quite the same, but one of these submissions also contained a different visualization on the torus. Though this is not really a drawing in the plane, it perfectly reflects the structure of the graph. Therefore, this pair of drawings by Maarten Löffler, David Eppstein, Michael Goodrich (UC Irvine) and Stephen Kobourov (University of Arizona) was judged to be the winning submission in this category.
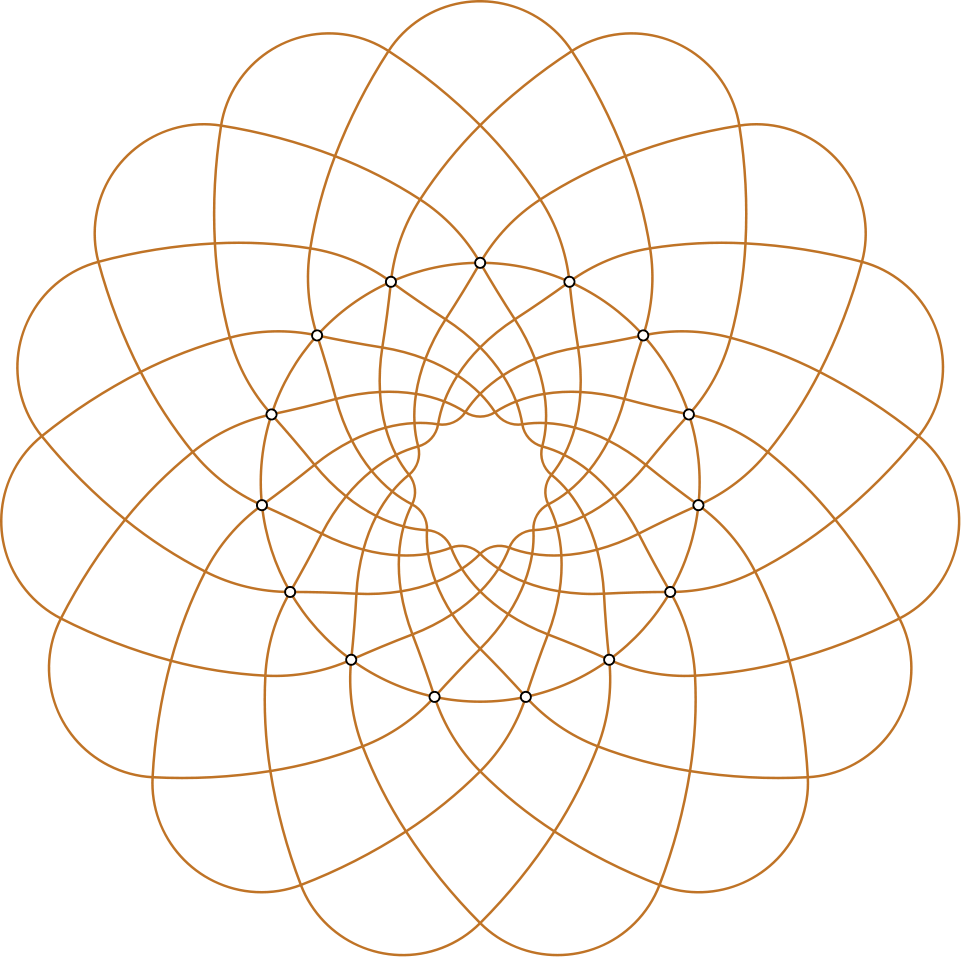
First place: Angular Resolution, Category B (click to enlarge)
poly-arc Lombardi (left) and toroidal 2-Lombardi (right)
Composers Graph
The composers graph was a large directed graph, where the nodes represented Wikipedia articles about composers, and the edges represented links between these articles. The graph had 3405 nodes and 13832 edges.
We received 5 submissions for the composers graph, including several high-quality submissions with movies, graph analysis, and specialized tools. The winning submission came from Remus Zelina, Sebastian Bota, Siebren Houtman, and Robert Ban (Meurs, Romania). The submission was comprised of an A0 poster of the graph's largest connected component with 2743 nodes and 13769 edges, a dynamic web page that allowed one to browse and analyze the graph, as well as a movie (YouTube) showing the dynamic web page in action. For many of the nodes, photos of the corresponding composers were added. The underlying graph layout was mainly computed using force-directed techniques. The layout revealed several modules (shown in different colors) corresponding to specific eras like Renaissance and Baroque, or genres like Russian composers and troubadours.
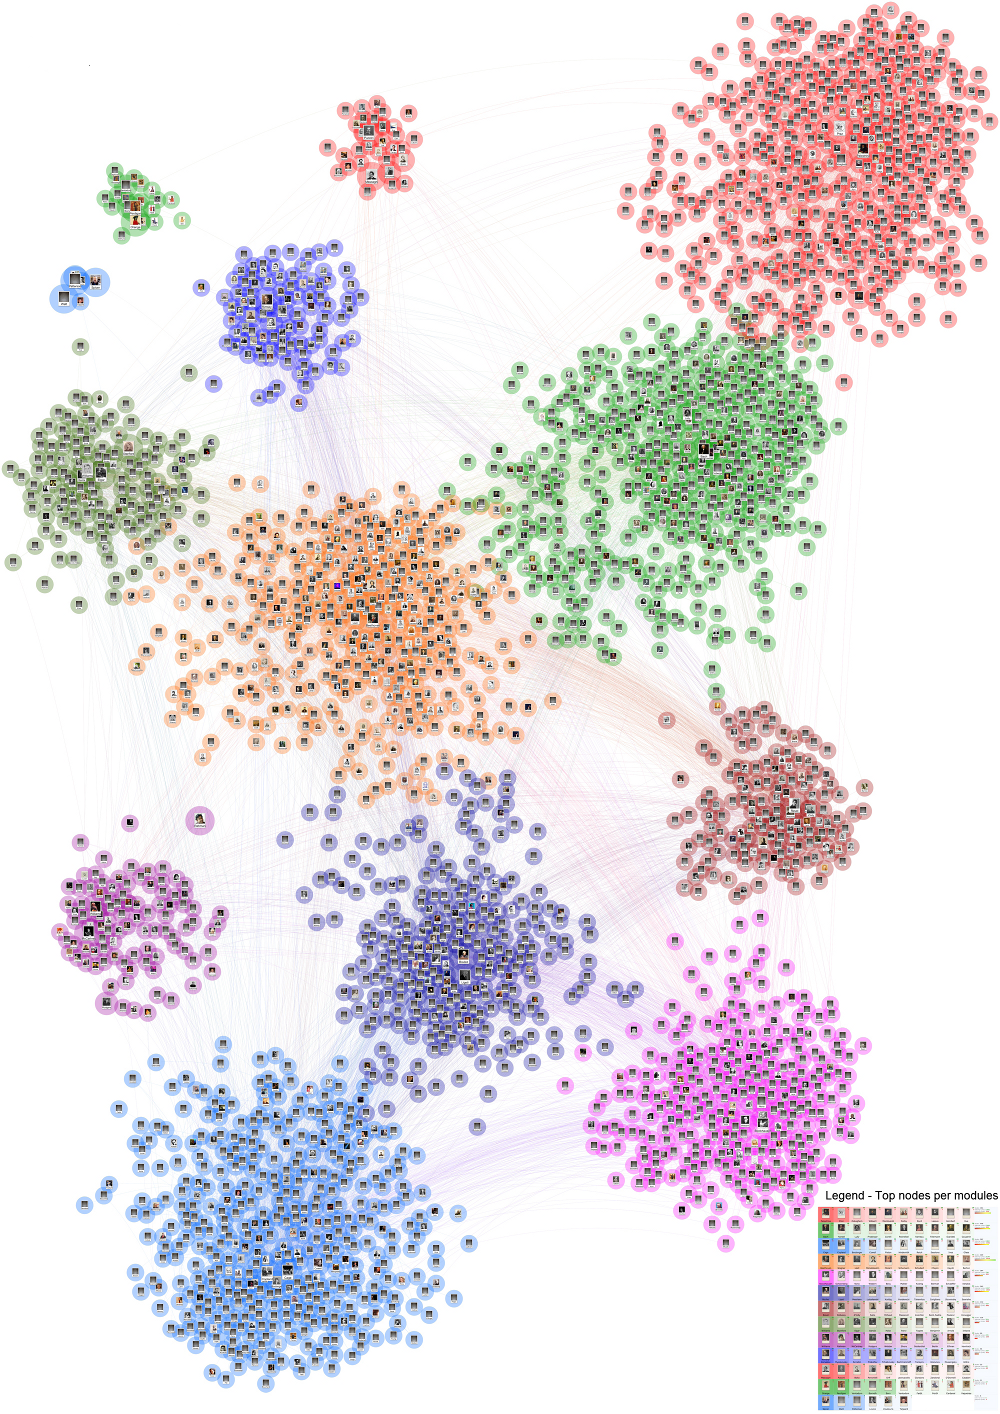
First Place: Composers Graph (click to enlarge)
Since we received many excellent submissions in this category, we also want to mention the following submissions.
- Emilio Di Giacomo and Fabrizio Montecchiani (University of Perugia) visualized the graph as a clustered network. They applied the SplitFM3 layout algorithm, followed by edge-bundling techniques and filtering out less important bundles. Their layout and analysis is shown in this YouTube video.
- Philip Effinger (University of Tübingen) developed a dedicated tool for the composers graph that allows interactive browsing and filtering. His layout shows the largest component of the graph and orders the composers on a time line, displaying only nodes with high centrality. The tool is presented in this YouTube video.
Graph Drawing Challenge
The online challenge, which took place during the conference, dealt with minimizing the longest edge in a planar orthogonal grid drawing. The longest edge can be a bottleneck for many applications; hence, minimizing its length is important. The challenge graphs were planar and had at most four incident edges per node. The task was to place nodes and edge bends on integer coordinates so that the edge routing is orthogonal and the layout contains no crossings or overlaps. At the start of the one-hour on-site competition, the contestants were given six graphs with an initial legal planar layout with very long edges. The goal was to rearrange the layout to reduce the length of the longest edge. Only the length of the longest edge was judged; other aesthetic criteria, such as the number of edge bends or the area, were ignored.
The contestants could choose to participate in one of two categories: automatic and manual. To determine the winner in each category, the scores of each graph, determined by dividing the longest edge length of the best submission in this category by the longest edge length of the current submission, were summed up. If no legal drawing of a graph was submitted (or a drawing worse than the initial solution), the score of the initial solution was used.
Automatic Category
In the automatic category, contestants received graphs ranging in size from 59 nodes / 85 edges to 1532 nodes / 2296 edges and were allowed to use their own sophisticated software tools with specialized algorithms. Manually fine-tuning the automatically obtained solutions was allowed. Six teams were rated in this category (2 manual teams accidentally solved the automatic graphs and were rated in both categories). The two top-scoring teams used the OGDF graph drawing library for obtaining an initial solution using flow-based bend minimization and compaction techniques combined with their own heuristics to optimize the solution. With a score of 5.05, the winner in the automatic category was Sergey Pupyrev from Ural State University.
Sample Graphs
The following graphs were the sample graphs for the automatic category. The list contains the initial configurations, best submissions (one example if there were several best submissions), and best solutions we know (if better then the submitted solutions).
-
automatic graph 1 (59 nodes, 85 edges, initial length 52) [.pdf]
best submitted (length: 6) [.pdf] (Pupyrev) -
automatic graph 2 (110 nodes, 118 edges, initial length 8) [.pdf]
best submitted (length: 2) [.pdf] (Gronemann, Mallach, Schmidt)
best known (length: 1, optimal) [.pdf] (manual submission by Löffler, Nöllenburg) -
automatic graph 3 (119 nodes, 151 edges, initial length 22) [.pdf]
best submitted (length: 11) [.pdf] (Pupyrev) -
automatic graph 4 (150 nodes, 186 edges, initial length 44) [.pdf]
best submitted (length: 4, optimal) [.pdf] (Michael, Torsten, Andreas) -
automatic graph 5 (1184 nodes, 1428 edges, initial length 222) [.pdf]
best submitted (length: 145) [.pdf] (Pupyrev) -
automatic graph 6 (1532 nodes, 2296 edges, initial length 554) [.pdf]
best submitted (length: 51) [.pdf] (Pupyrev)
Manual Category
The 14 manual teams solved the problems by hand using IBM's Simple Graph Editing Tool provided by the committee (download .jar file). They received graphs ranging in size from 9 nodes / 17 edges to 150 nodes / 186 edges. Three of the larger input graphs were also in the automatic category, and the best manual teams scored similar (for two graphs) and better (for one graph) than the automatic teams. With a score of 3.82, the winner in the manual category was the team of Maarten Löffler (UC Irvine) and Martin Nöllenburg (Karlsruhe Institute of Technology) who found the best results for three of the six contest graphs.
Sample Graphs
The following graphs were the sample graphs for the manual category. The list contains the initial configurations, best submissions (one example if there were several best submissions), and best solutions we know (if better then the submitted solutions).
-
manual graph 1 (9 nodes, 17 edges, initial length 9) [.pdf]
best submitted (length: 6) [.pdf] (Rote, Mutzel) -
manual graph 2 (27 nodes, 38 edges, initial length 38) [.pdf]
best submitted (length: 5, optimal) [.pdf] (Klavik, Krug, Rutter) -
manual graph 3 (59 nodes, 85 edges, initial length 52) [.pdf]
best submitted (length: 6) [.pdf] (Opmanis) -
manual graph 4 (110 nodes, 118 edges, initial length 8) [.pdf]
best submitted (length: 1, optimal) [.pdf] (Löffler, Nöllenburg) -
manual graph 5 (118 nodes, 144 edges, initial length 58) [.pdf]
best submitted (length: 11) [.pdf] (Bruckdorfer, Effinger)
best known (length: 6) [.pdf] -
manual graph 6 (150 nodes, 186 edges, initial length 44) [.pdf]
best submitted (length: 4, optimal) [.pdf] (Michael, Torsten, Andreas)
Acknowledgments
The contest committee would like to thank the generous sponsors of the symposium and all the contestants for their participation.

![]()
![]()
![]()
![]()