Results of the
20th Graph Drawing Contest
This page reports on the results of the 20th Annual Graph Drawing Contest, held in conjunction with the 2013 Graph Drawing Symposium in Bordeaux (Talence), France.
This year, the Graph Drawing Contest was divided into an offline contest and an online challenge. The offline contest had three categories: two dealt with creating and visualizing a graph from a given data set and one was a review network. The data sets for the offline contest were published months in advance, and contestants could solve and submit their results before the conference started. The submitted drawings were evaluated according to aesthetic appearance and how well the data was visually represented. For the visualization itself, typical drawings, interactive tools, animations, or other innovative ideas were allowed.
The online challenge took place during the conference in a format similar to a typical programming contest. Teams were presented with a collection of challenge graphs and had approximately one hour to submit their highest scoring drawings. This year's topic was to minimize the area for orthogonal grid layouts, where we allowed crossings (the number of crossings was not judged, only the area counted).
Overall, we received 12 submissions: 3 submissions for the offline contest and 9 submissions for the online challenge.
Creative
For the two categories in this topic, the task was to create a meaningful graph from data found on a specific website and visualize it in a suitable way. Any kind of visualization was allowed. We proposed pictures, map-like drawings, animations, and interactive tools, but any other innovative idea was also welcome. A submission should include the graph itself as well as the visualization.
Category A: Bordeaux Wines
The first data set could be found on the Bordeaux Wines website.
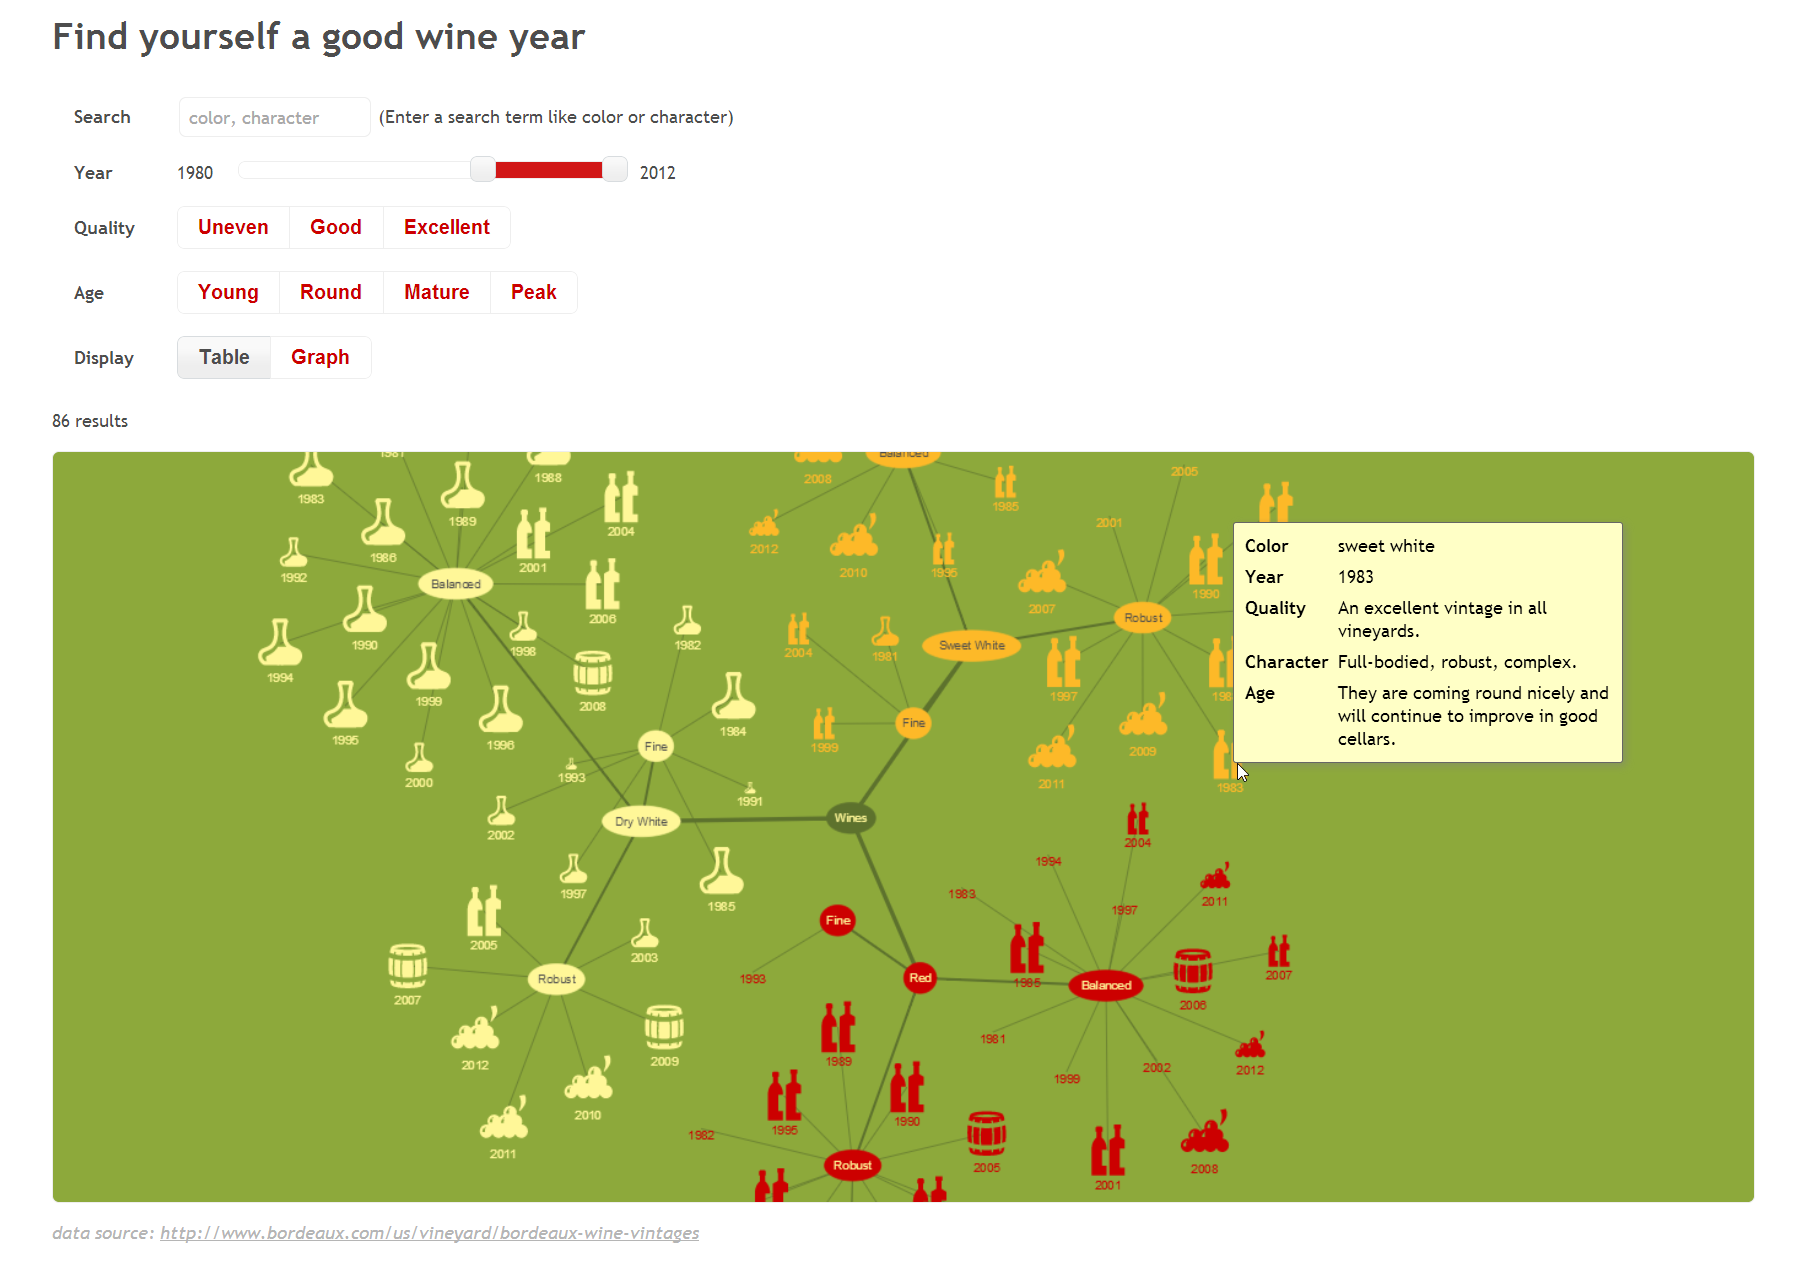
Submission by de Jong and Pazienza (click to enlarge)
We received 2 submissions in this category, both included an interactive web site for visualizing the data. The web page by Jos de Jong and Giovanni Pazienza provides filtering and shows a dynamic layout, which is smoothly adjusted when new nodes appear or nodes disappear due to changing the filter. The submission by Remus Zelina et al. is also an interactive web page (wine vintages and wines selections) providing filtering, but here the graph is visualized in a map-like fashion obtained by a preceding clustering of the data.
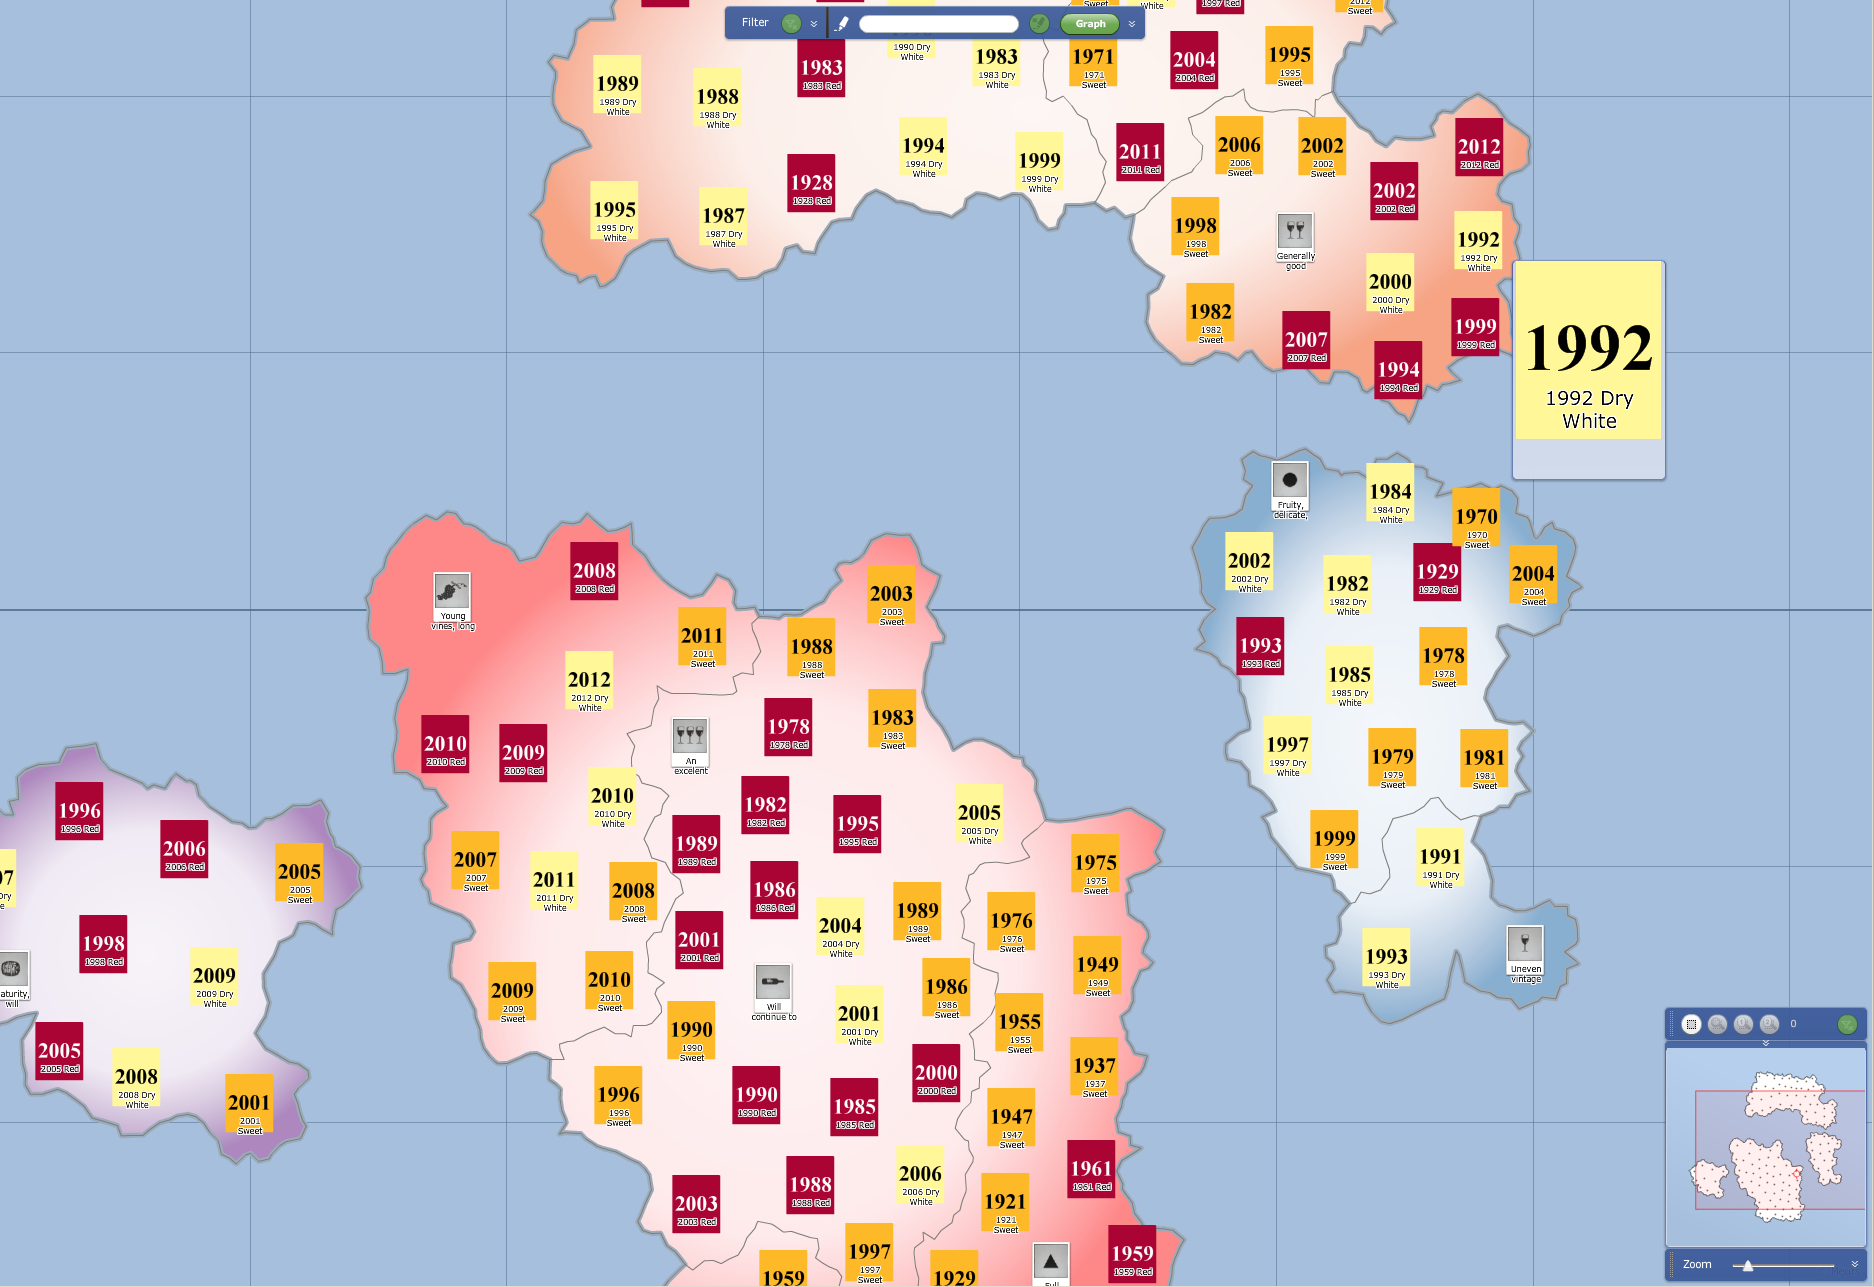
Submission by Zelina et al. (click to enlarge)
The winner in this category was the team Jos de Jong and Giovanni Pazienza from Almende B.V., the Netherlands, for their clear and easy-to-use visualization of Bordeaux wines.
Category B: Bordeaux City
The second data set could be found on the official website of the city of Bordeaux. Unfortunately, we did not receive any submissions in this category.
Review Network
In this category the task was to visualize a review network that has been obtained from Amazon reviews on fine foods. The data set for the review network could be obtained from the SNAP website of Stanford University. The network included 568,454 reviews, collected over a period of more than 10 years, including 74,258 products and 256,059 reviewers. Each review contained the product ID of the food (which allowed the look up of the product at Amazon), the user ID of the reviewer, and further interesting information like the score and the date of the review. The visualization should make the importance of reviewers and the quality of products visible. Again, any kind of suitable visualization was allowed.
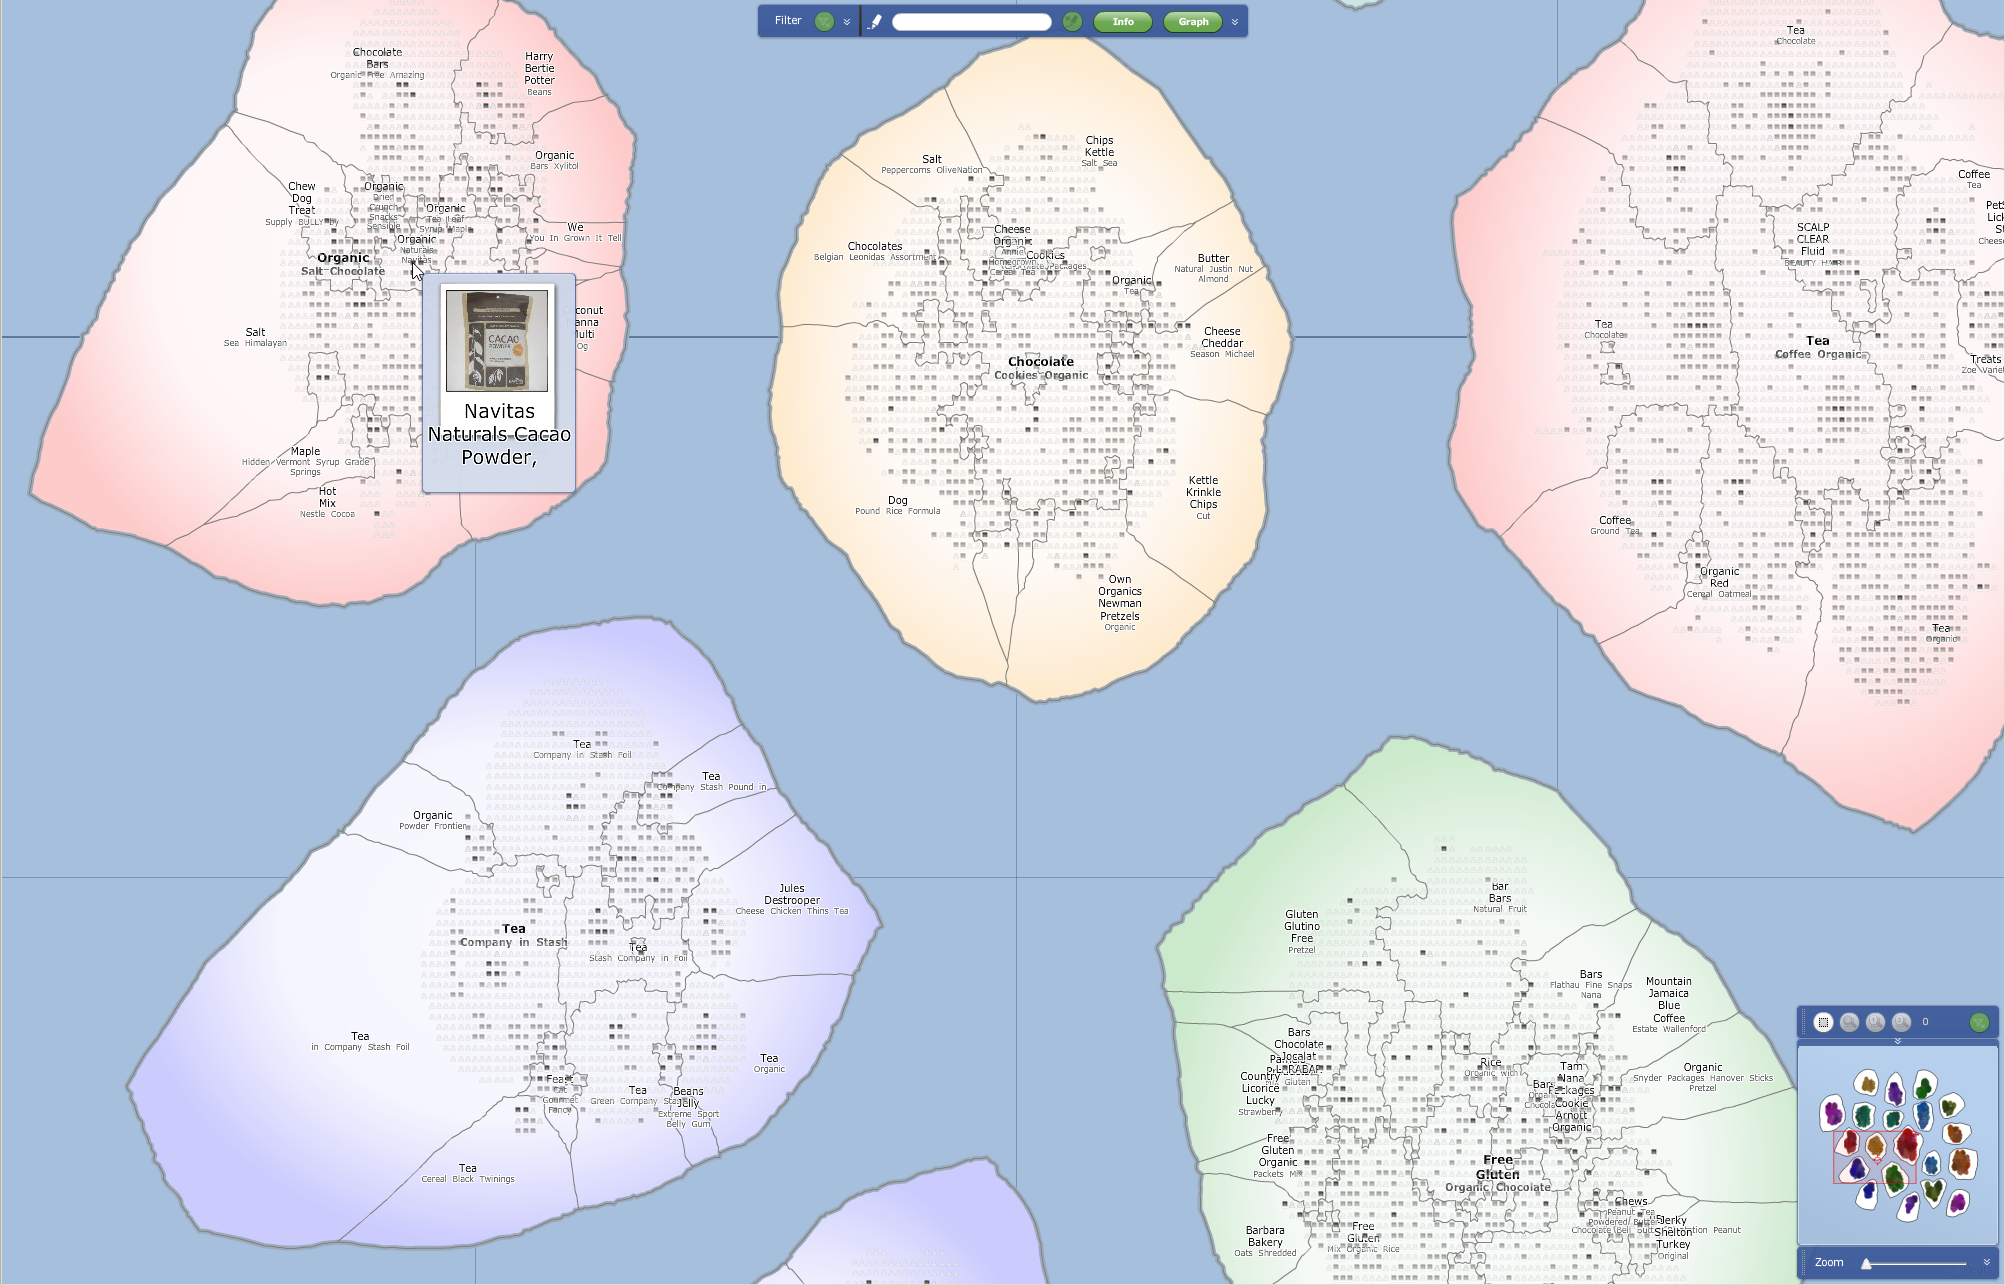
Submission by Zelina et al. (click to enlarge)
We only received a single submission in this category, which was again an interactive web page (important products and reviewers and similar products). The network was drawn in a map-like fashion clustering the nodes into islands like Chocolate, Tea, or Coffee. When zooming in, more details are revealed and important nodes are highlighted. Hence, the winner in this category was the team Remus Zelina, Sebastian Bota, Siebren Houtman, and Radu Balaban from Meurs, Romania.
Online Challenge
The online challenge, which took place during the conference, dealt with minimizing the area in an orthogonal grid drawing. The challenge graphs were not necessarily planar and had at most four incident edges per node. Edge crossings were allowed and their number did not affect the score of a layout. Since typical drawing systems first try to minimize the number of crossings, which might result in long edges increasing the required area, we were in particular interested in the effect of allowing crossings on the quality of layouts when trying to reduce the area.
The task was to place nodes, edge bends, and crossings on integer coordinates so that the edge routing is orthogonal and the layout contains no overlaps. At the start of the one-hour on-site competition, the contestants were given six graphs with an initial legal layout with a large area. The goal was to rearrange the layout to reduce the area, defined as the number of grid points in the smallest rectangle enclosing the layout. Only the area was judged; other aesthetic criteria, such as the number of crossings or edge bends, were ignored.
The contestants could choose to participate in one of two categories: automatic and manual. To determine the winner in each category, the scores of each graph, determined by dividing the area of the best submission in this category by the area of the current submission and then taking the square root, were summed up. If no legal drawing of a graph was submitted (or a drawing worse than the initial solution), the score of the initial solution was used.
In the automatic category, contestants received six graphs ranging in size from 59 nodes / 87 edges to 3393 nodes / 4080 edges and were allowed to use their own sophisticated software tools with specialized algorithms. Manually fine-tuning the automatically obtained solutions was allowed. However, no team participated in this category, hence we had no winner in the automatic category this year.
The 9 manual teams solved the problems by hand using IBM's Simple Graph Editing Tool provided by the committee (download .jar file). They received six graphs ranging in size from 19 nodes / 26 edges to 150 nodes / 188 edges. Three of the larger input graphs were also in the automatic category; unfortunately we could not compare automatic solutions with manual solutions this time. With a score of 5.485, the winner in the manual category was the team of Thomas Bläsius and Ignaz Rutter from Karlsruhe Institute of Technology who found the best results for two of the six contest graphs.
Sample Graphs
The following graphs were the sample graphs for the automatic and manual categories, given in the challenge graph file format and as PDFs. The list contains the initial configurations, best submissions, and best solutions we know (if better than the submitted solutions).
- manual graph 1 (19 nodes, 26 edges)
initial [.pdf] (area: 814) • best submitted [.pdf] (area: 42) - manual graph 2 (35 nodes, 44 edges)
initial [.pdf] (area: 768) • best submitted [.pdf] (area: 70)
best known [.pdf] (area: 49) - manual graph 3, auto graph 1 (59 nodes, 87 edges)
initial [.pdf] (area: 600) • best submitted [.pdf] (area: 315) - manual graph 4, auto graph 2 (110 nodes, 120 edges)
initial [.pdf] (area: 480) • best submitted [.pdf] (area: 224) - manual graph 5 (118 nodes, 148 edges)
initial [.pdf] (area: 896) • best submitted [.pdf] (area: 750) - manual graph 6, auto graph 3 (150 nodes, 188 edges)
initial [.pdf] (area: 990) • best submitted [.pdf] (area: 696) - auto graph 4 (1184 nodes, 1430 edges)
initial [.pdf] (area: 19,5364) - auto graph 5 (1532 nodes, 2298 edges)
initial [.pdf] (area: 20,992) - auto graph 6 (3393 nodes, 4080 edges)
initial [.pdf] (area: 1,399,489)
Acknowledgments
The contest committee would like to thank the generous sponsors of the symposium and all the contestants for their participation.
Diamond Sponsor
Gold Sponsor

Silver Sponsor

Bronze Sponsor

Sponsors