Contest Results
The 25th Annual Graph Drawing Contest was held in conjunction with the 26th International Symposium on Graph Drawing and network Visualization (GD 2018).
The contest had two parts: the Creative Topics and the Live Challenge.
The creative topics had two graphs: the first one was a graph about characters in the Game of Thrones television series, and the second one described adviser-advisee relationships between mathematicians. The data sets were published a year in advance, and contestants submitted their drawings before the conference started. Submissions were evaluated according to aesthetic appeal, domain-specific requirements, and how well the data was visually represented. For details, see here.
The live challenge took place during the conference in a format similar to a typical programming contest. Teams were presented with a collection of challenge graphs and had one hour to submit their highest scoring drawings. This year's topic was to maximize the smallest crossing angle in a straight-line drawing of a graph with vertex locations restricted to a grid. For details, see here.
Overall, we received 44 submissions: 31 submissions for the creative topics and 13 submissions for the live challenge.
Creative Topics: Game of Thrones
Creative Topics: Mathematics Genealogy
Live Challenge: Manual Category
Live Challenge: Automatic Category
Creative Topics: Game of Thrones
The TV show "Game of Thrones" is based on the book series "Song of Ice and Fire" by George R. R. Martin and is one of the most popular TV shows in the previous years. For the contest, we extracted the relations between some of the most important characters in the show as of the end of Season 7 from the Game of Thrones Wiki. The graph consists of 84 characters and 216 relations.
We received 23 submissions for this category. We selected 5 contenders for the prizes, which were printed on large poster boards and presented at the Graph Drawing Symposium. Out of those contenders, we selected 3 winning submissions. We will now first present the submissions that unfortunately did not make the top 5.

We will now present the top 5 submissions.
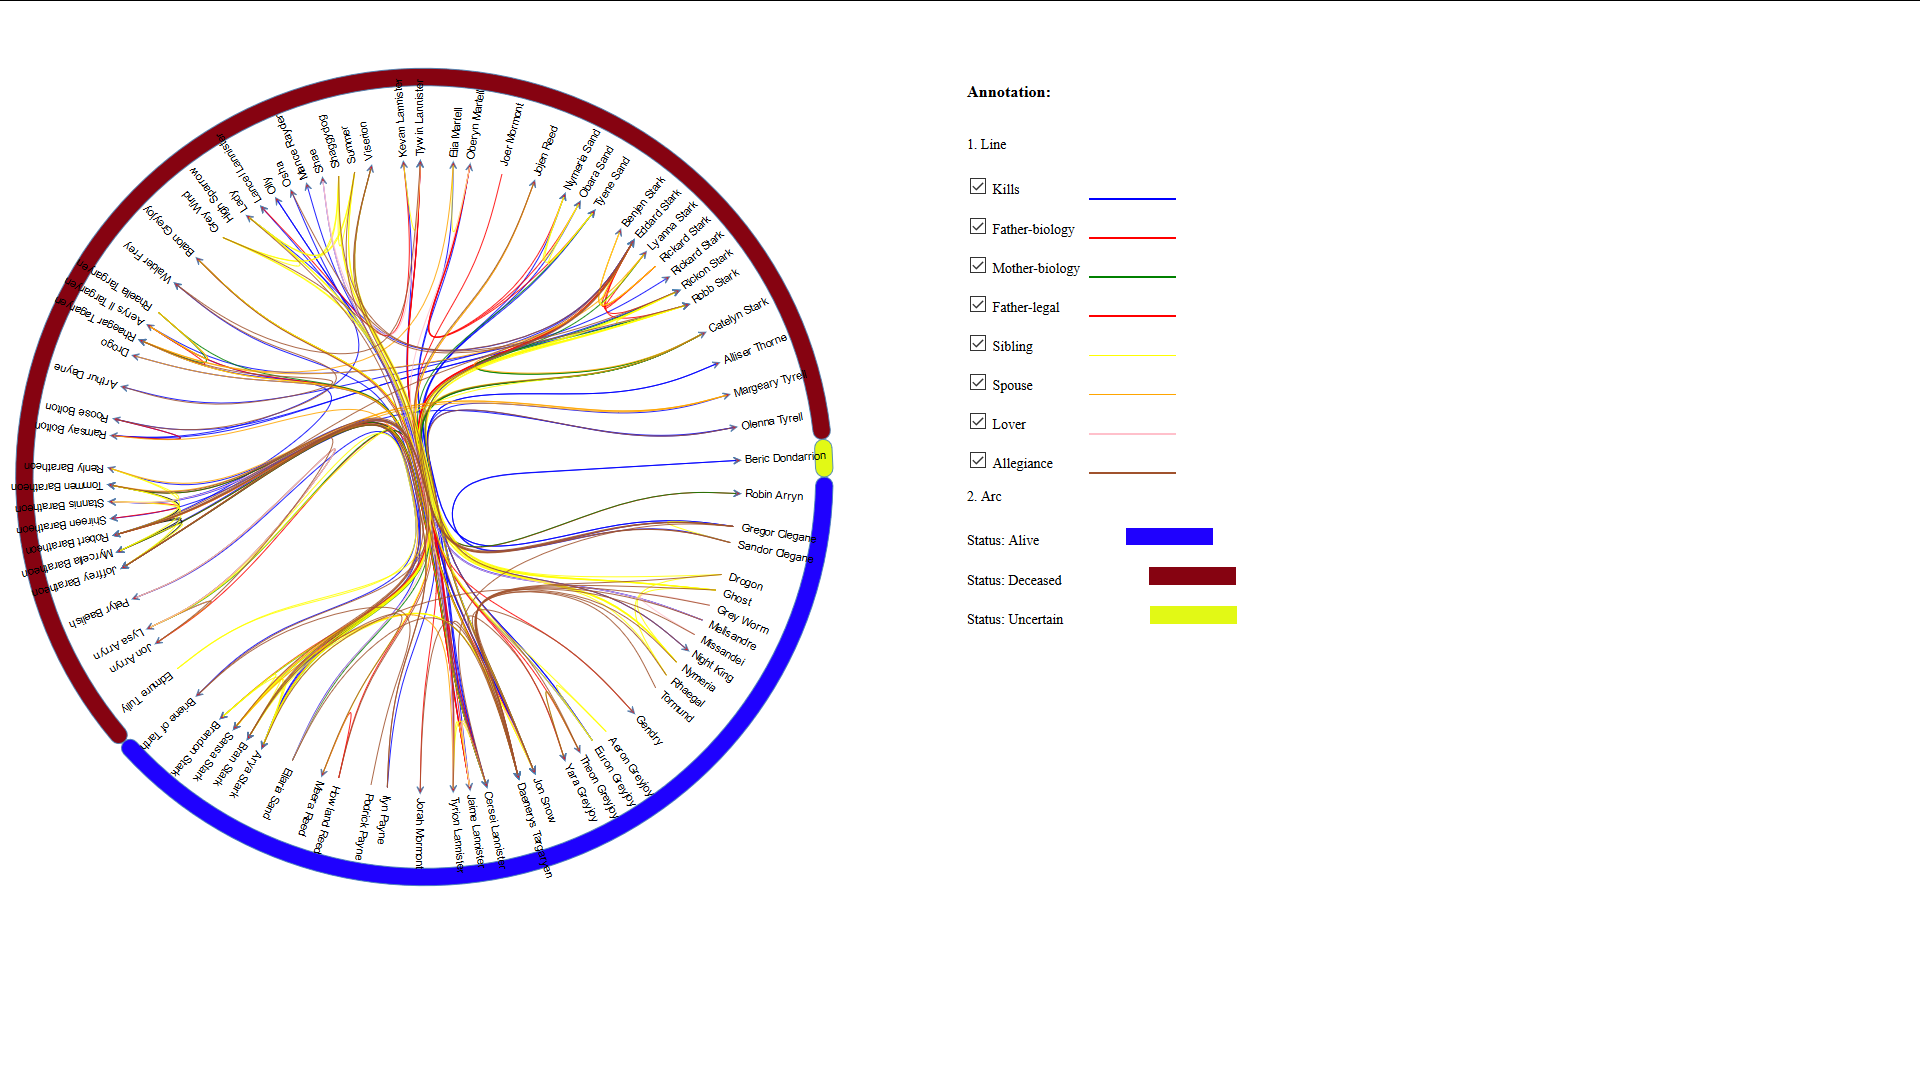
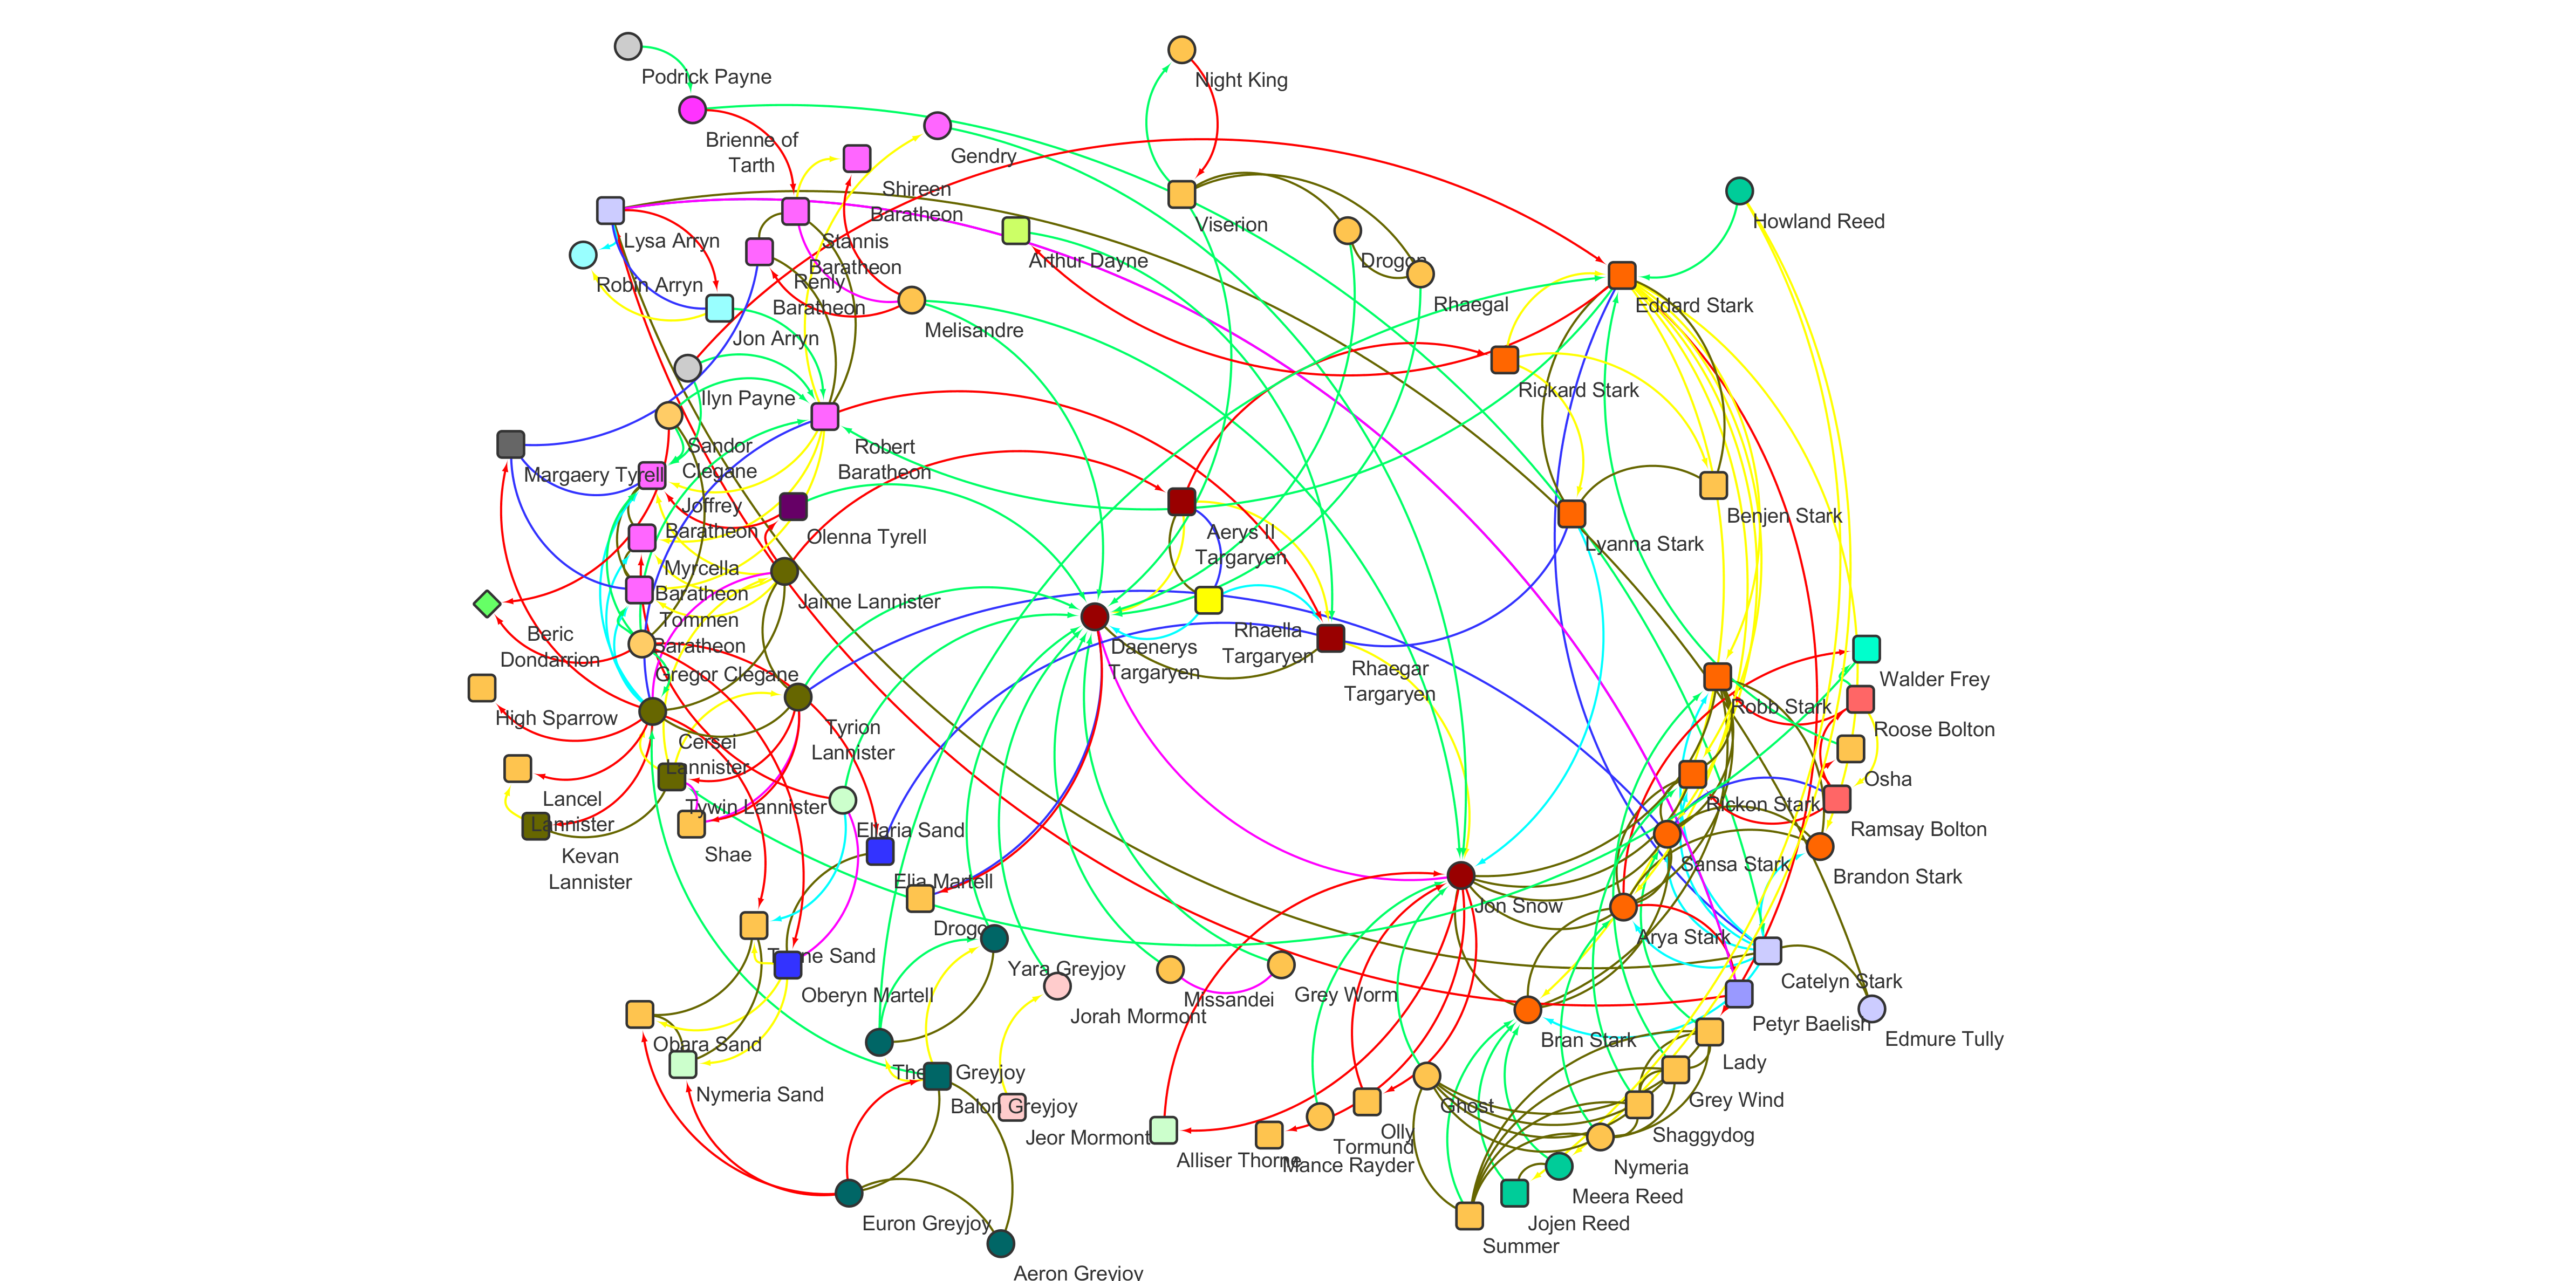
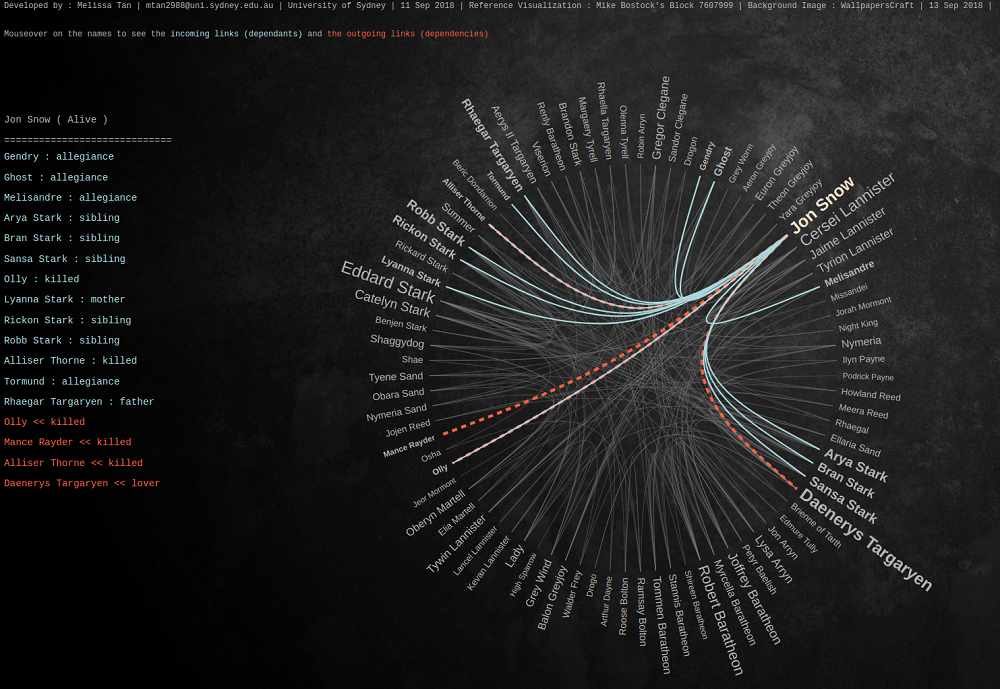
4th-5th Place:
Melissa Tan (University of Sydney)
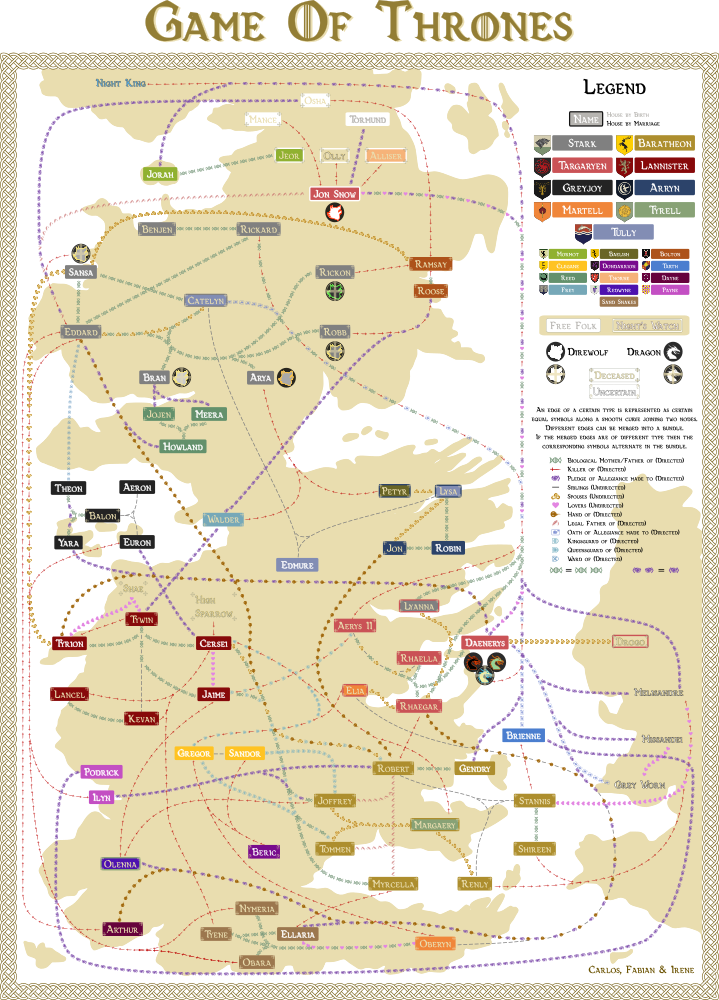
4th-5th Place:
Carlos Hidalgo Toscano (CINVESTAV), Fabian Klute (TU Wien), and Irene Parada (TU Graz)
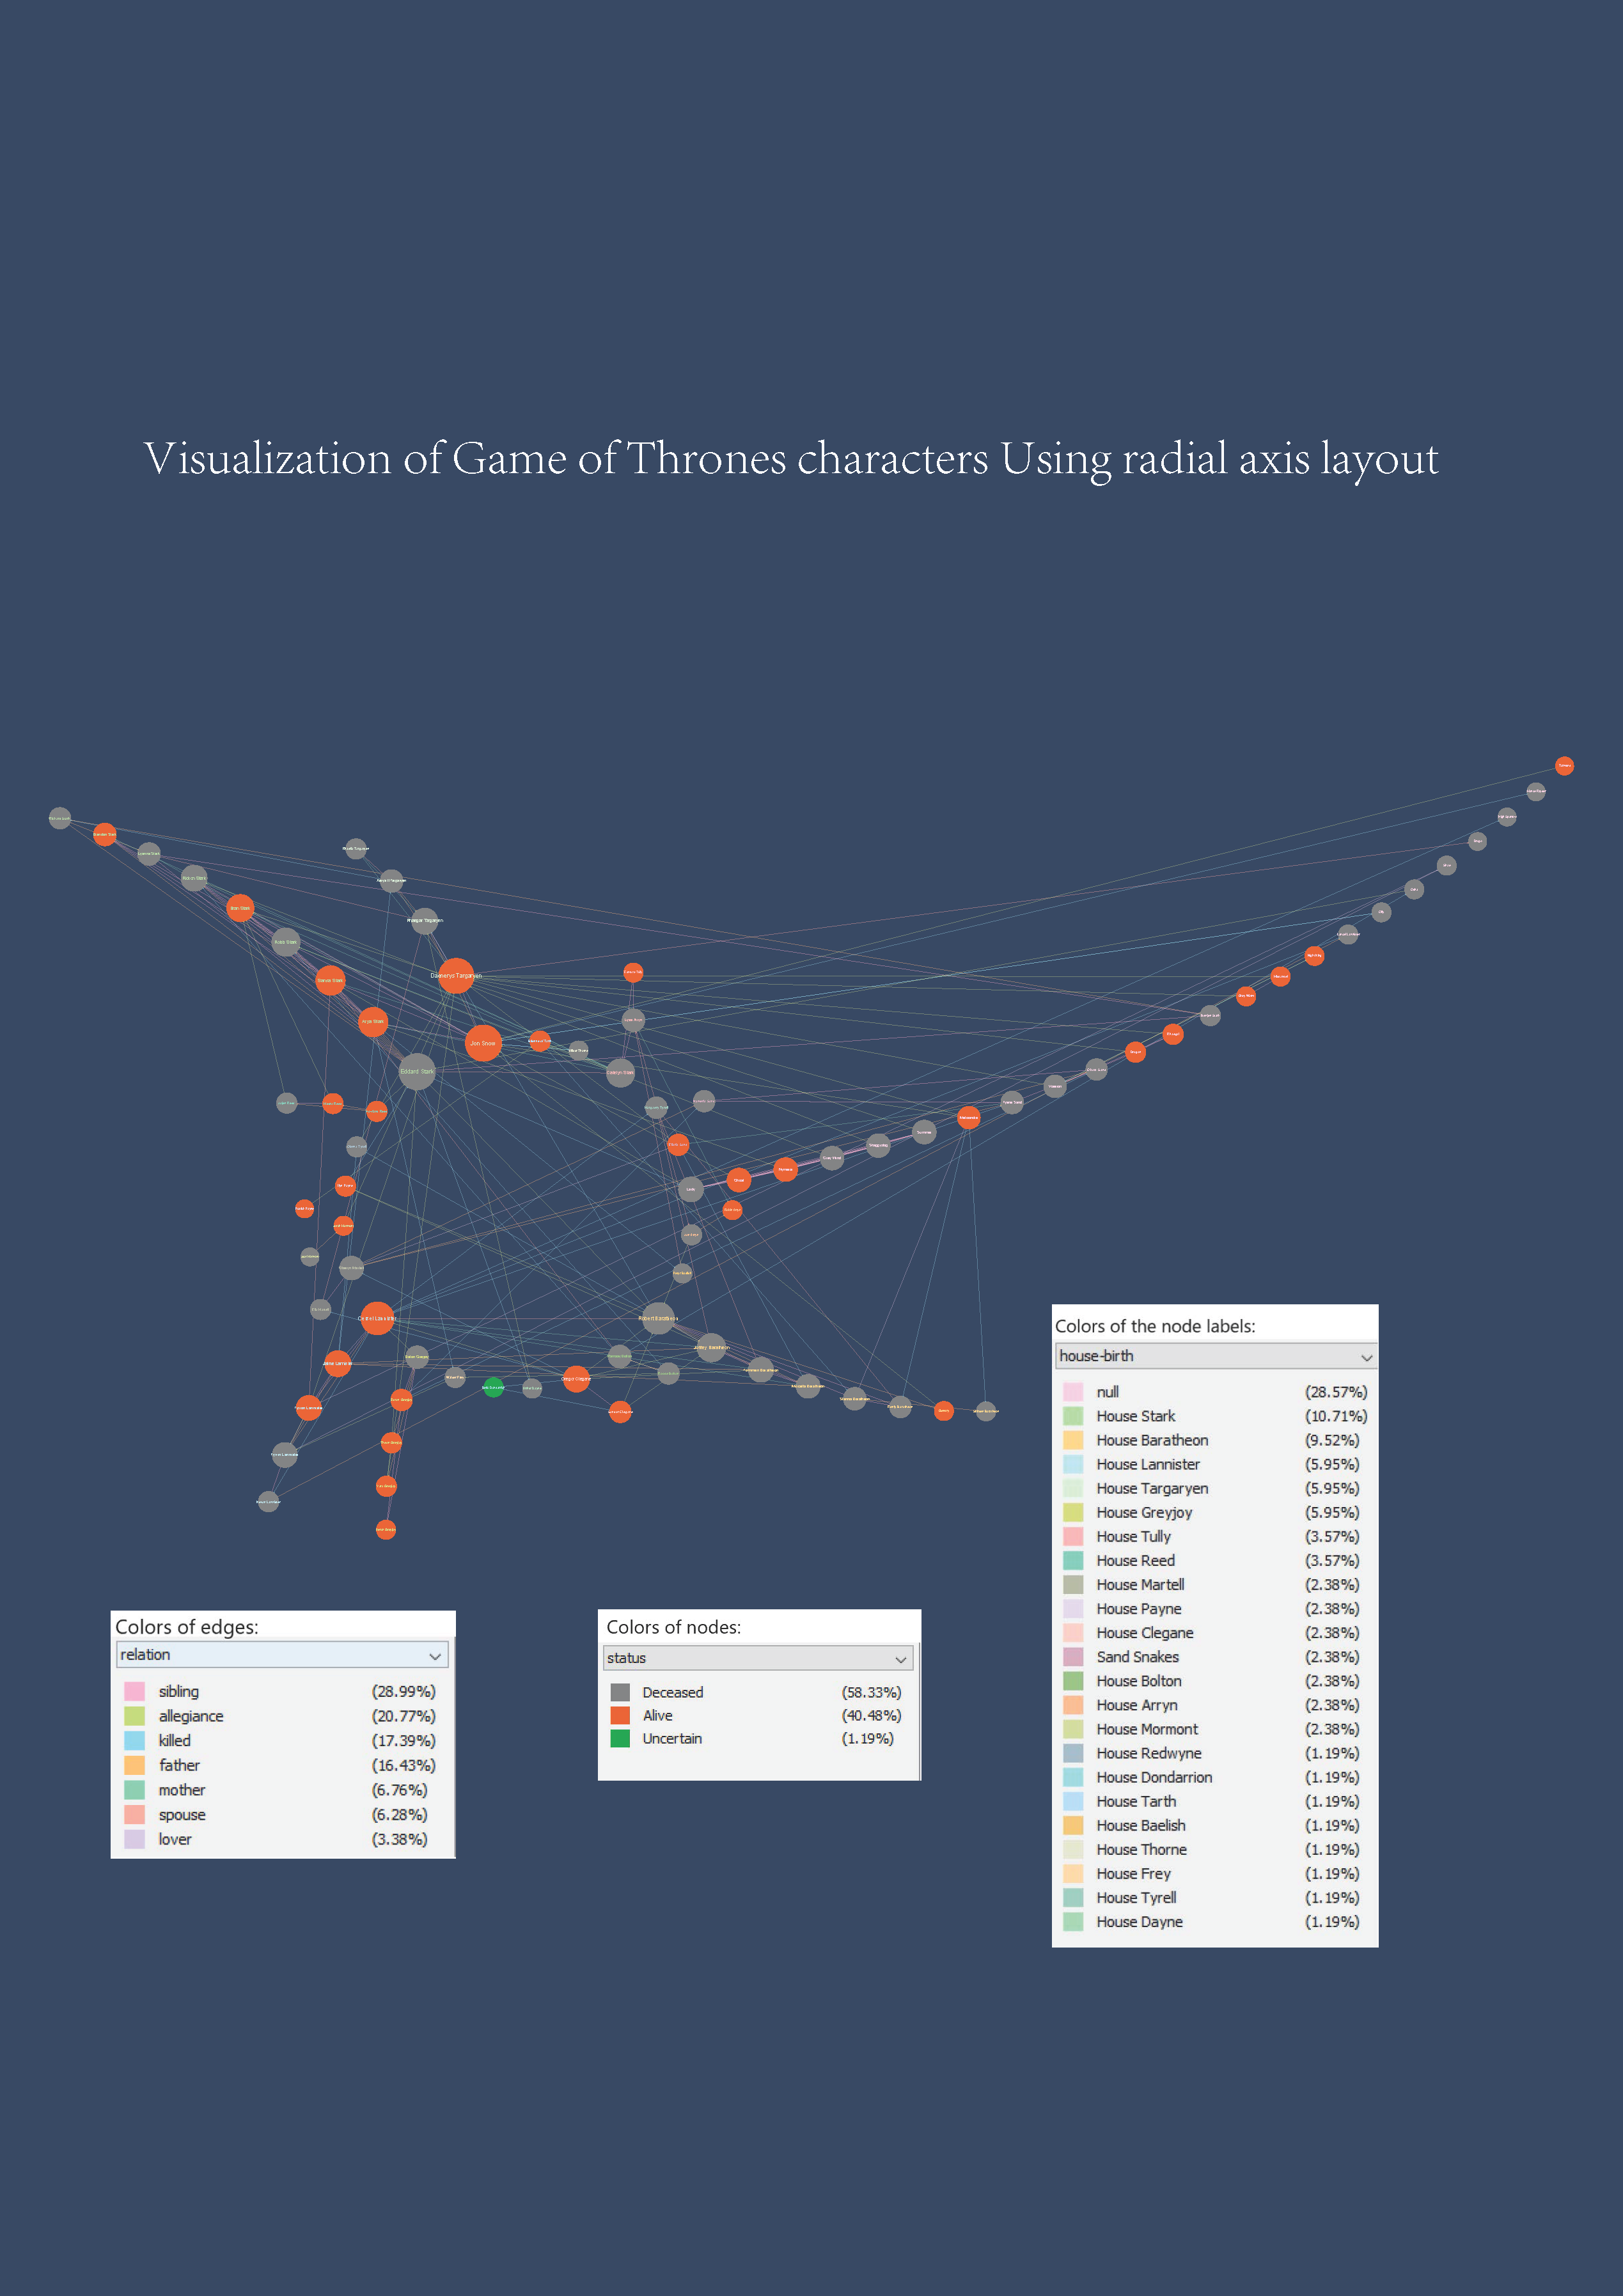
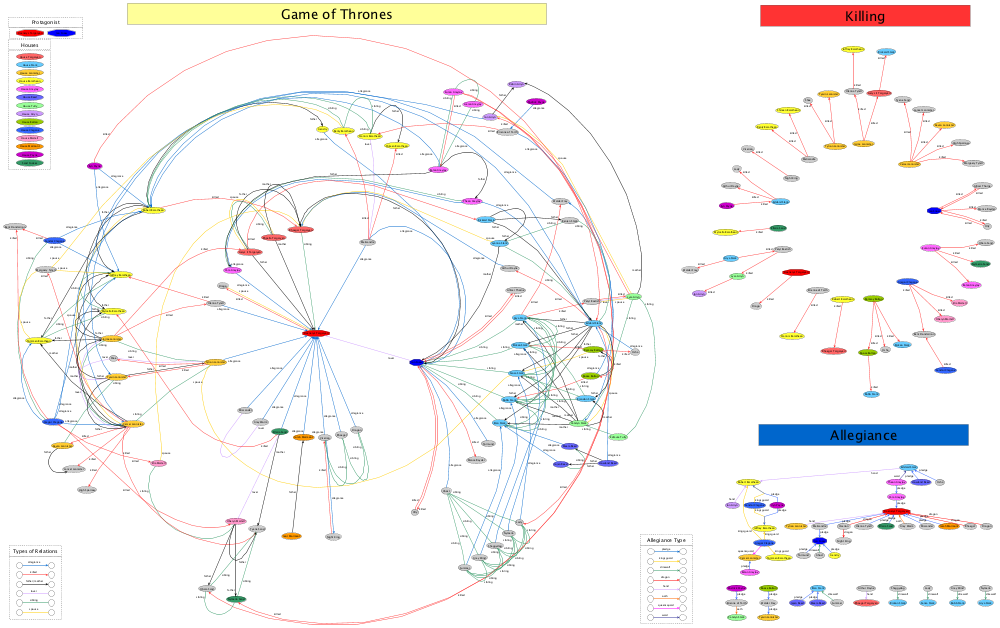
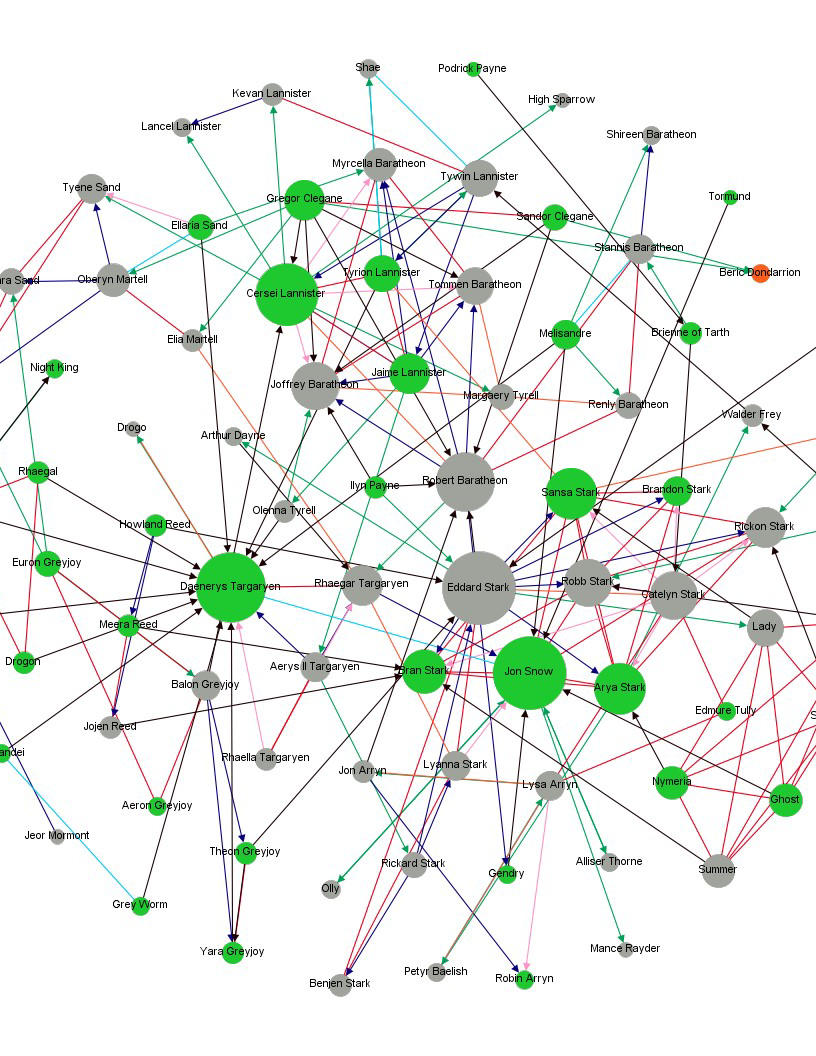
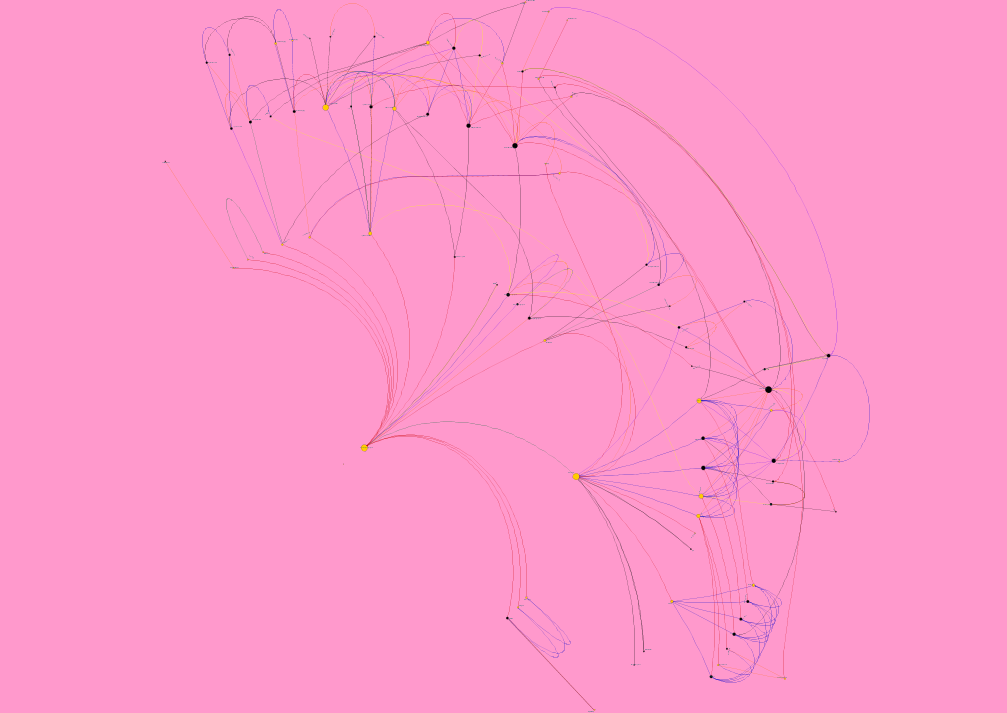
3rd Place:
Velitchko Filipov, Davide Ceneda, Michael Koller, Alessio Arleo, and Silvia Miksch (TU Wien)
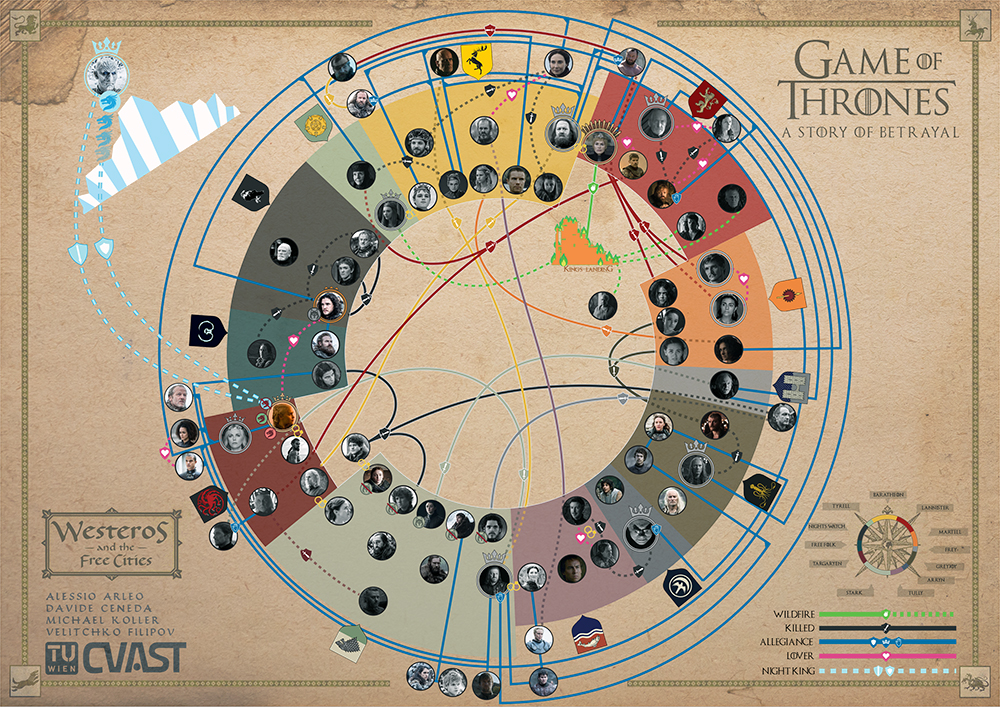
The committee likes the overall aesthetics of the drawing, and the clever combination of using both the interior and exterior space for routing edges in this radial layout.
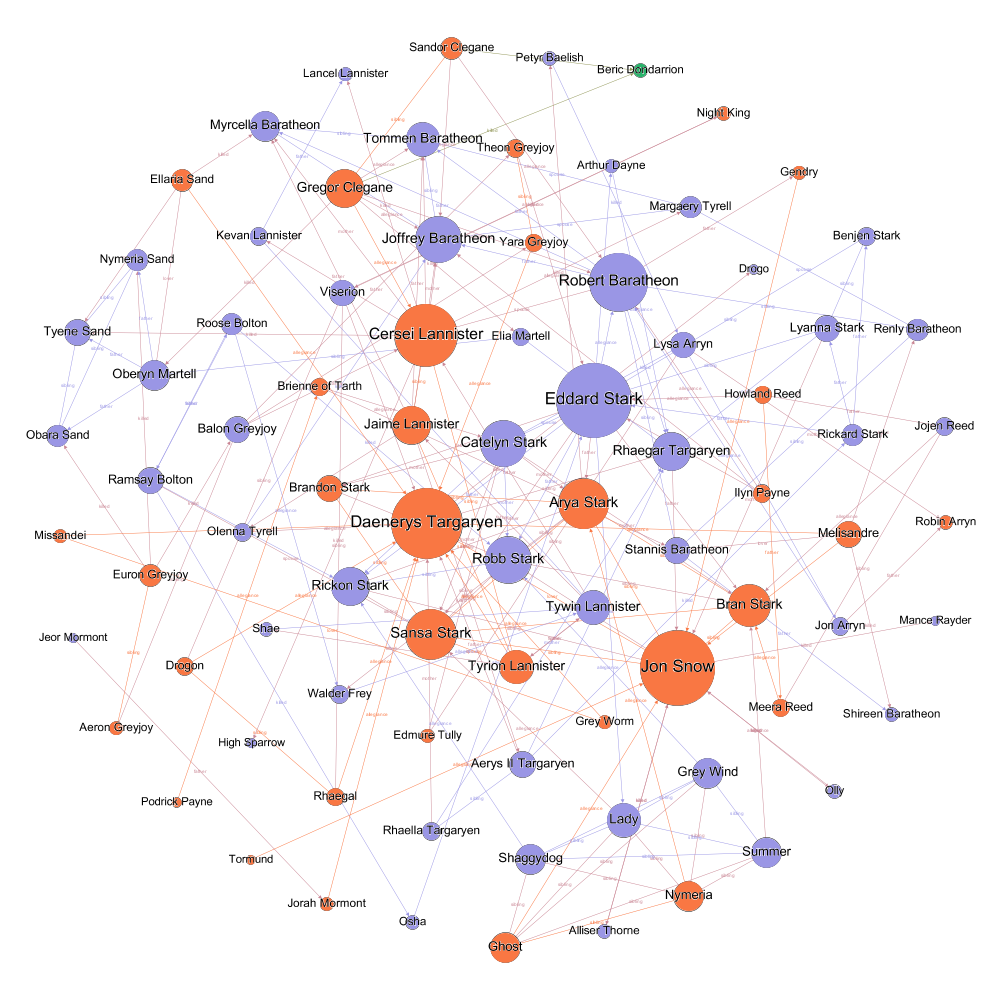
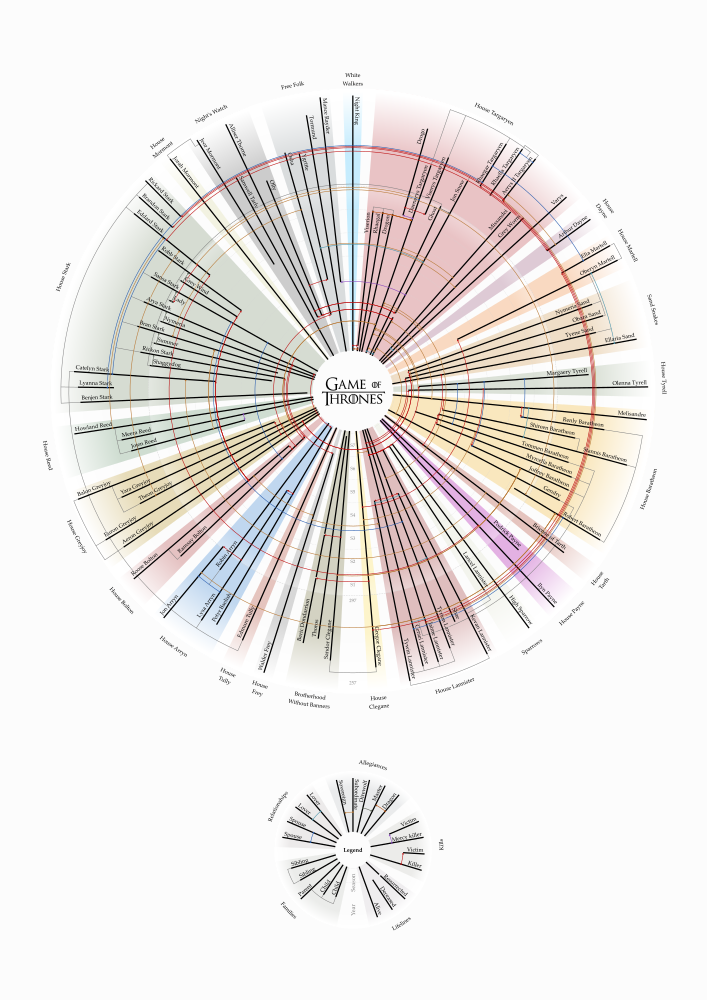
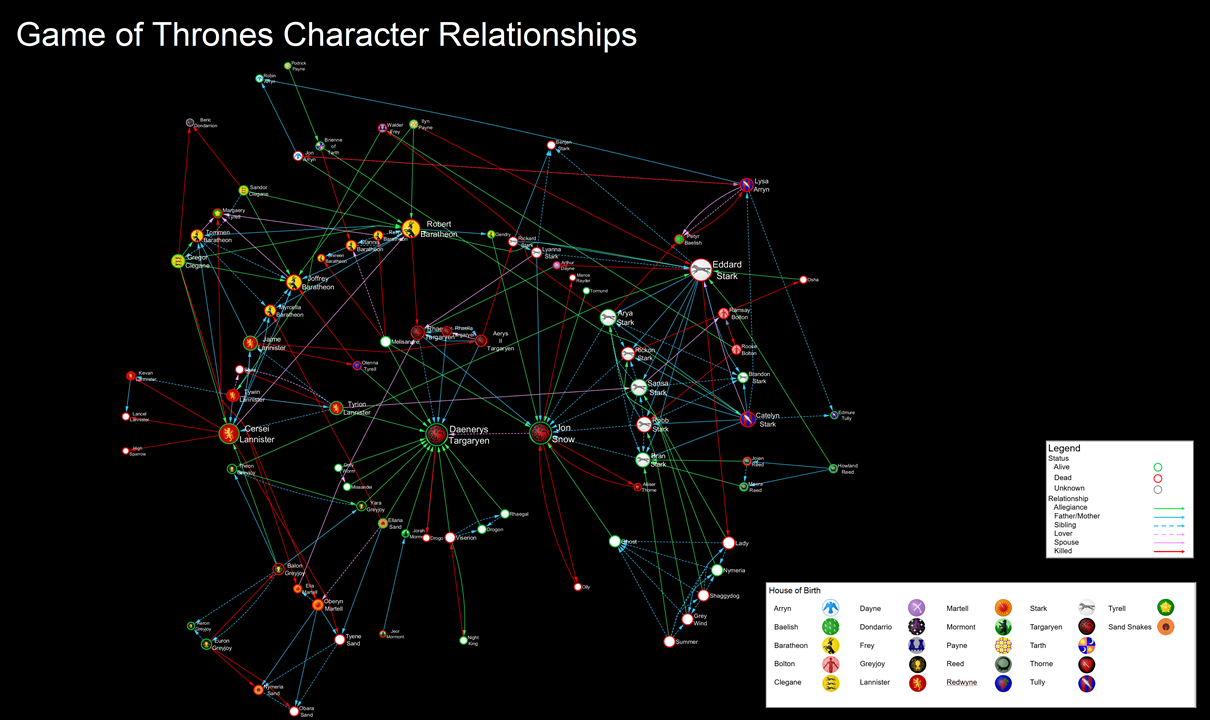
2nd Place:
Marian Amann, Philipp de Col, and Markus Wallinger (TU Wien)
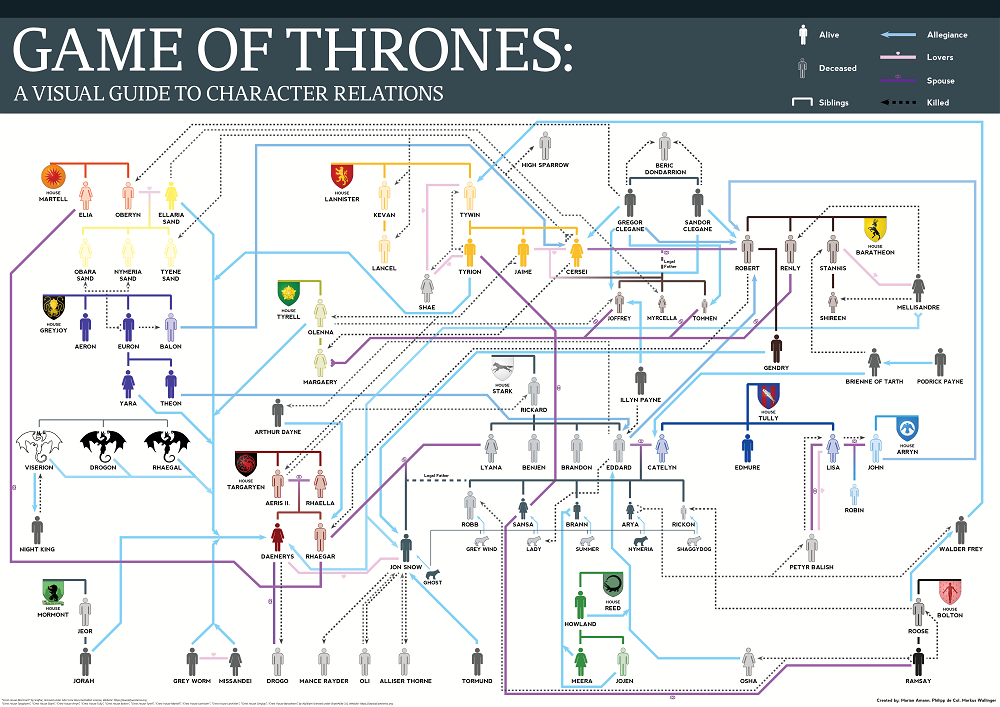
The committee likes the clarity of this layout, with a good global overview of the graph structure, as well as showing lower-level connections between different individual characters.
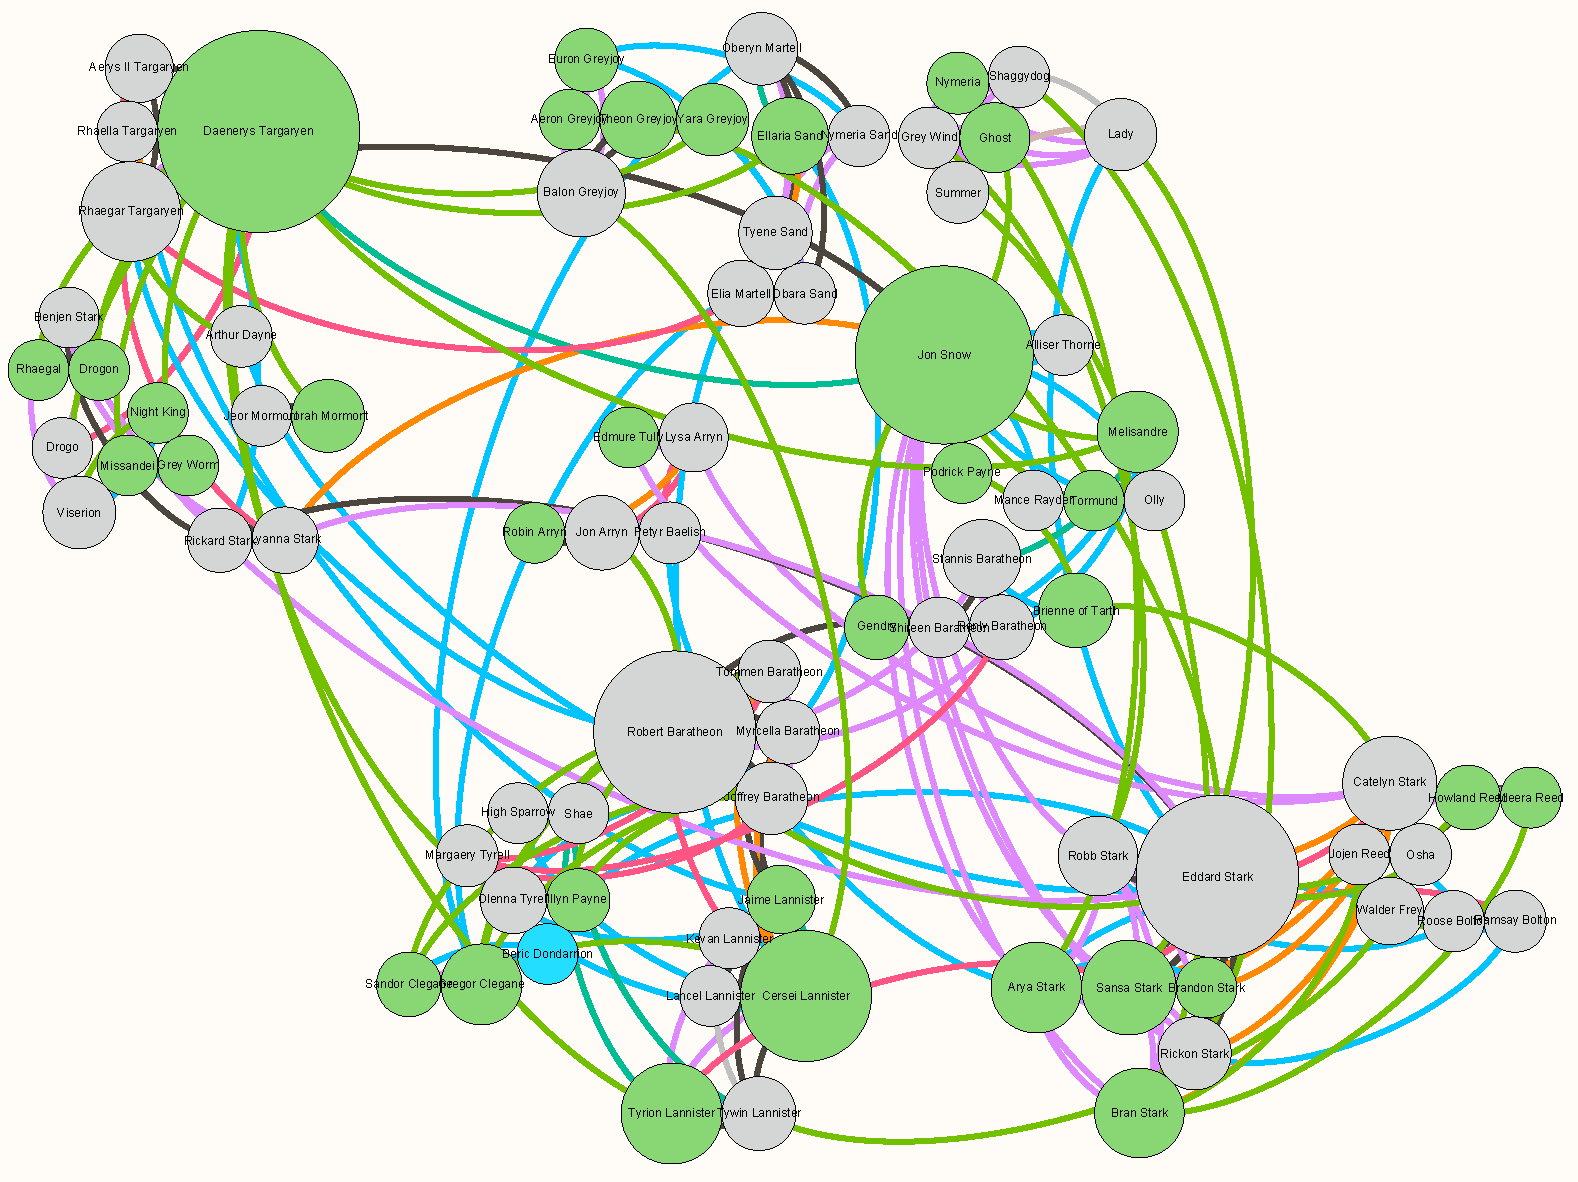
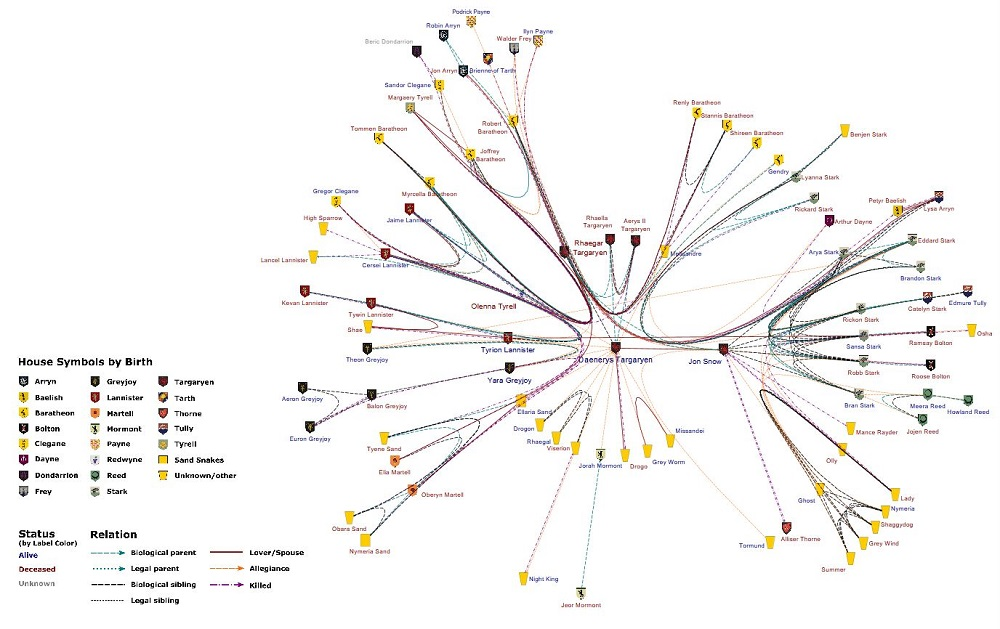
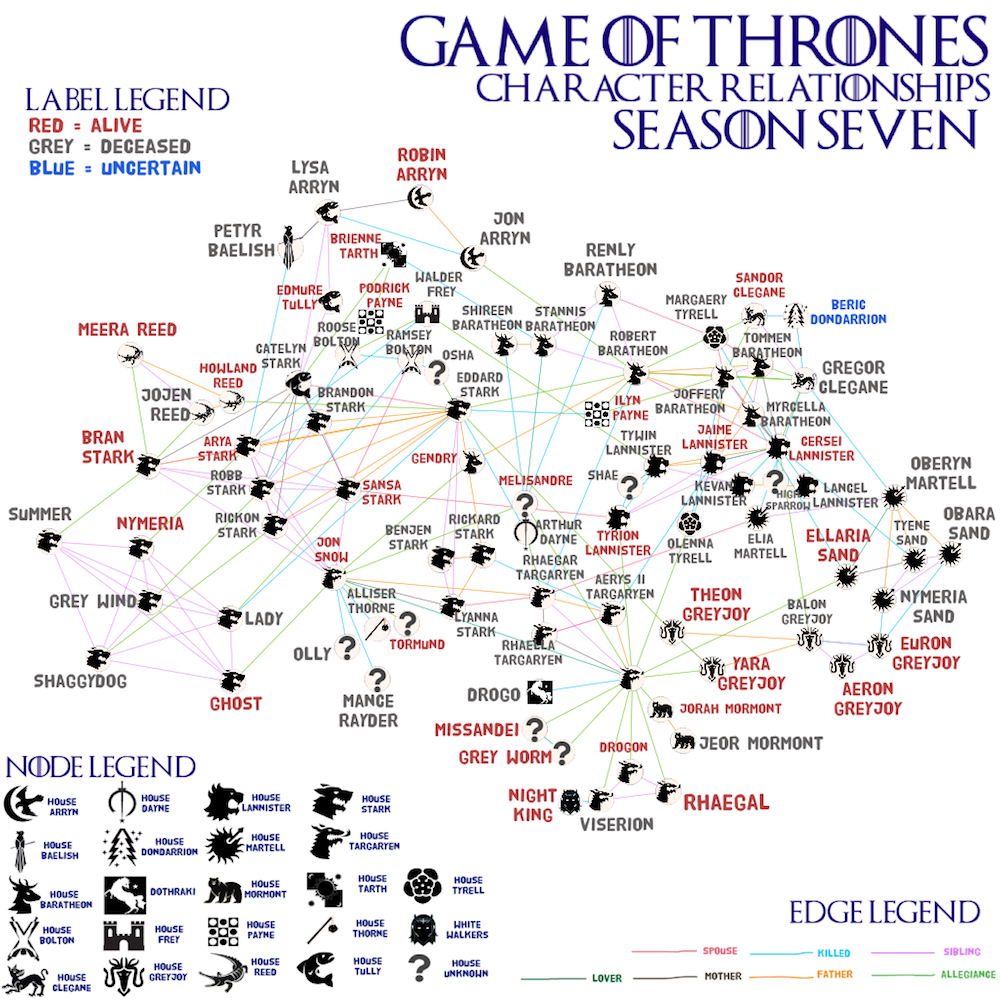
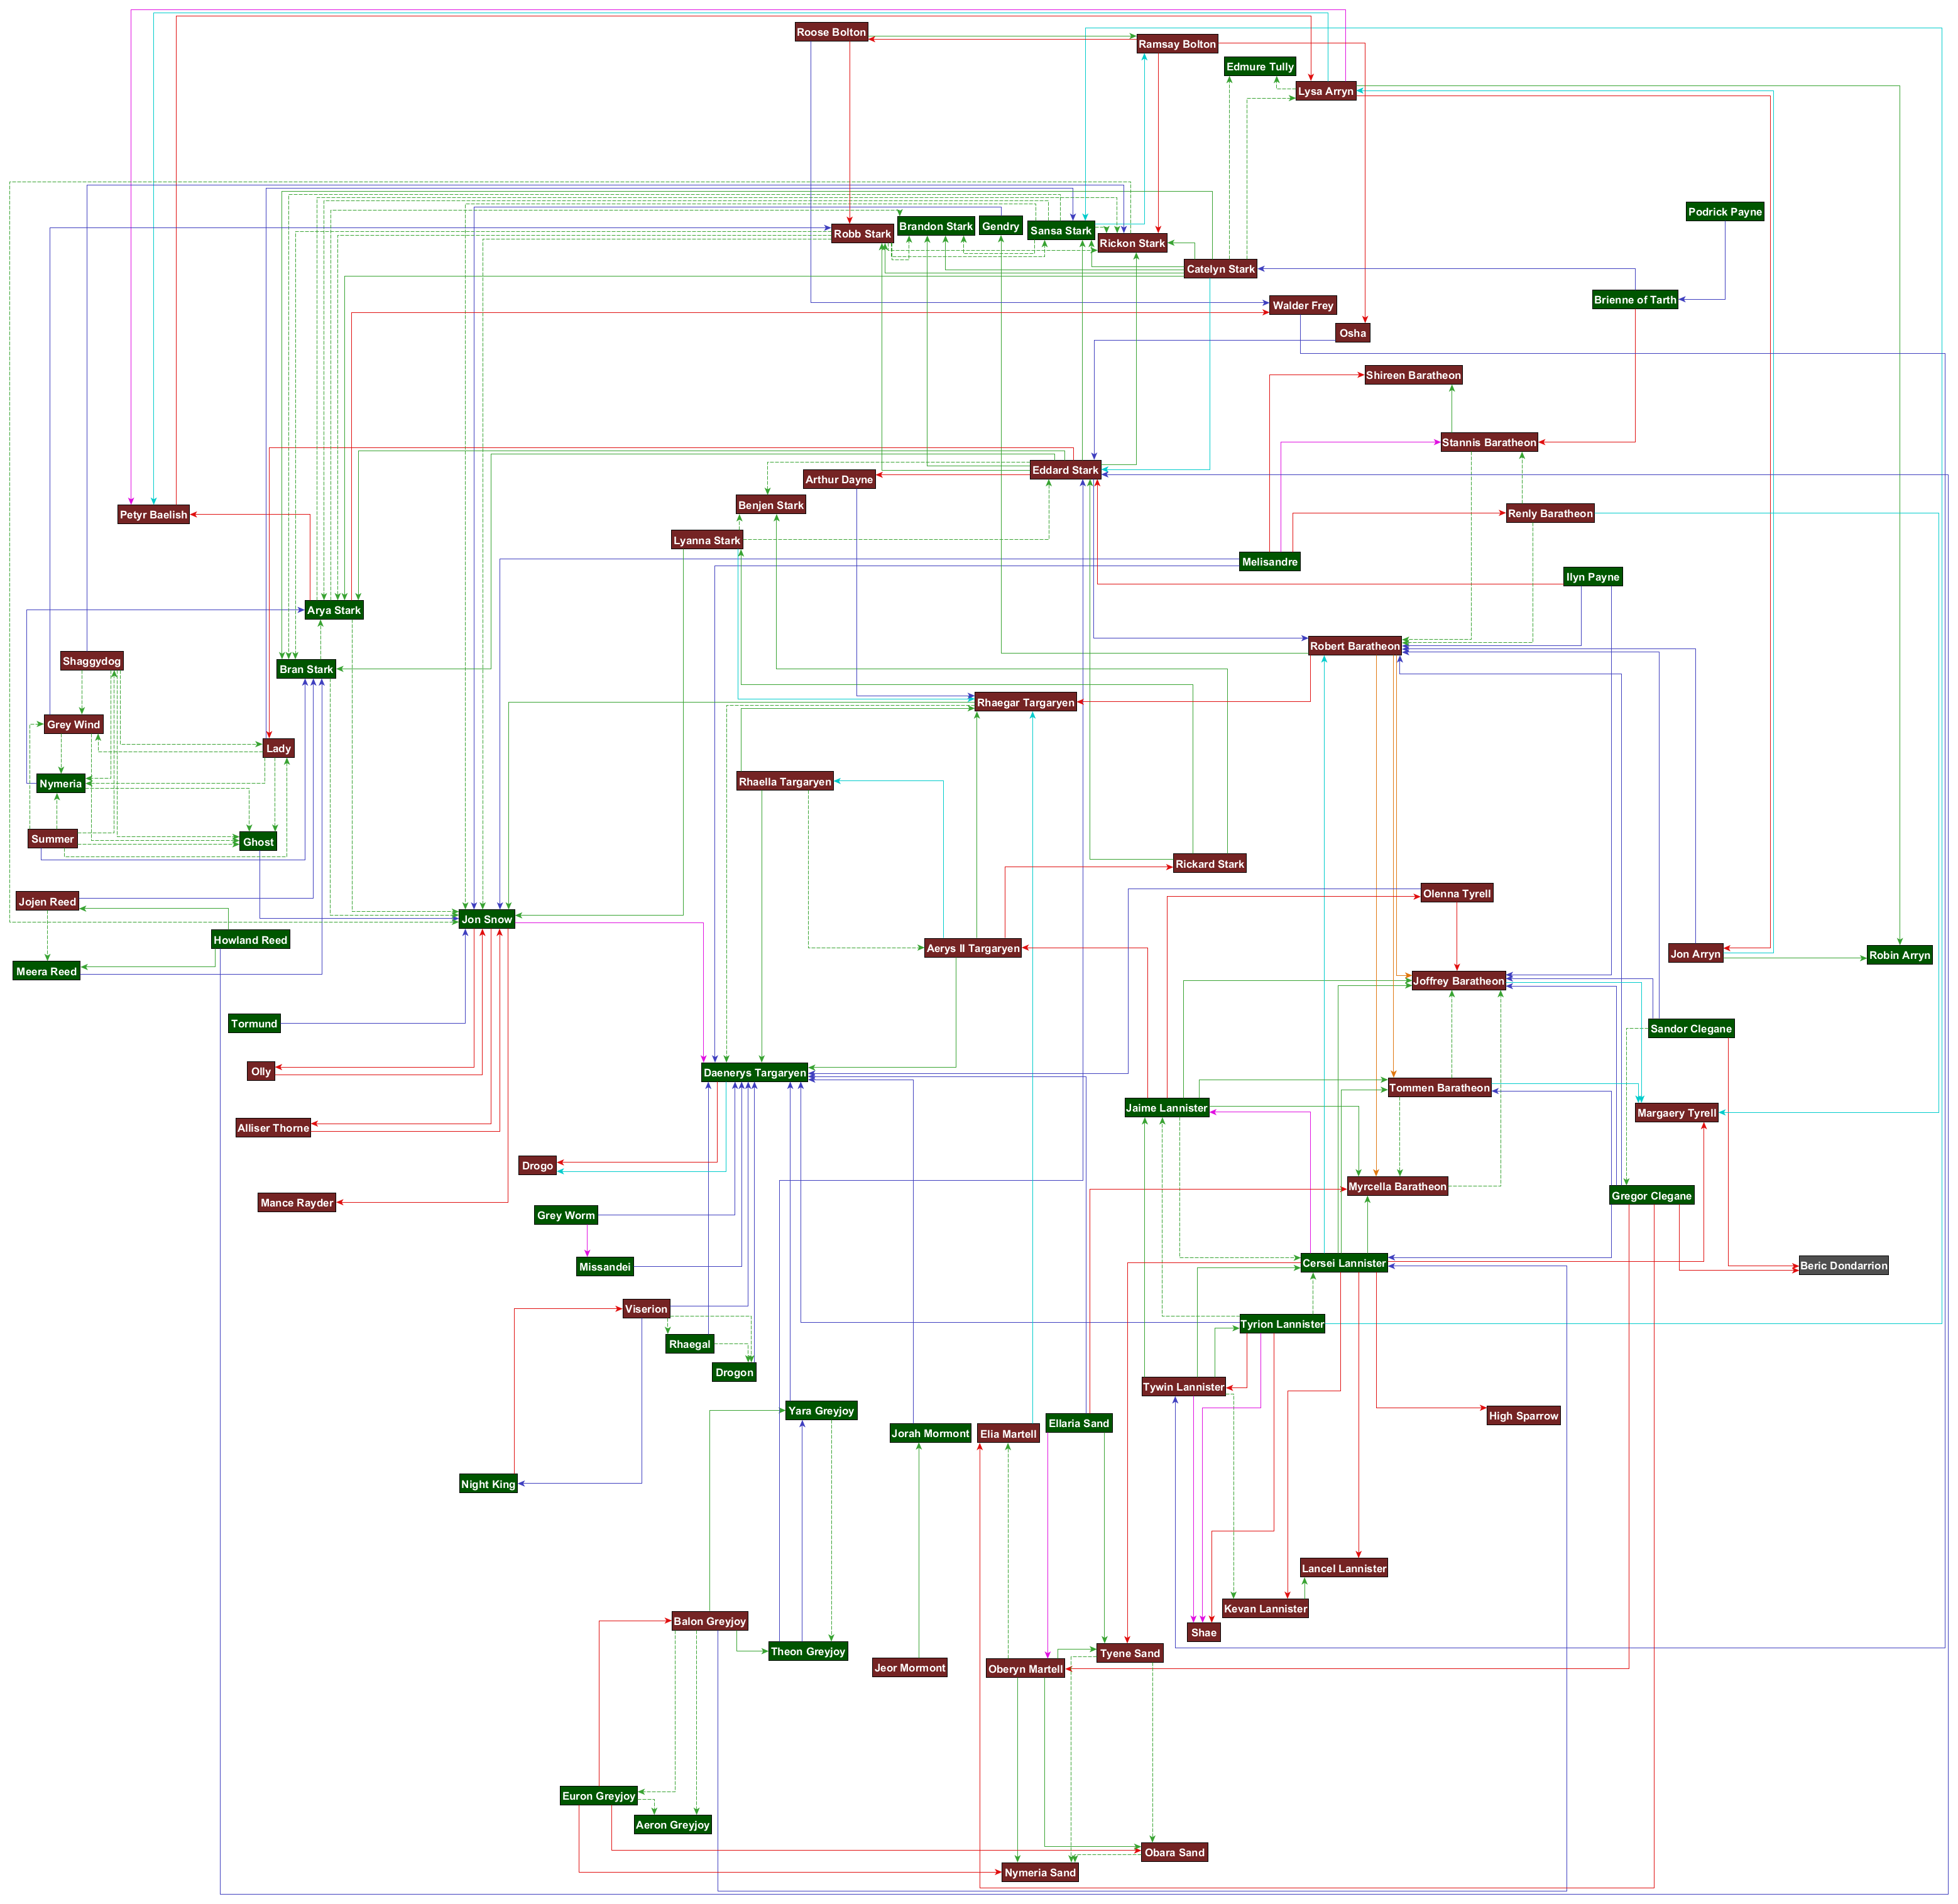
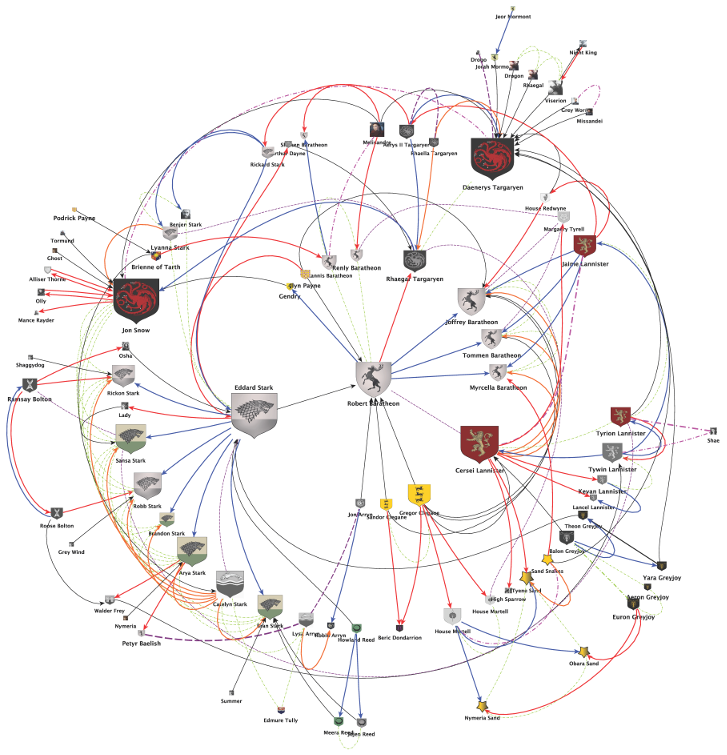
1st Place:
Evmorfia Argyriou, Michael Baur, Anne Eberle, and Armin Gufler (yWorks)
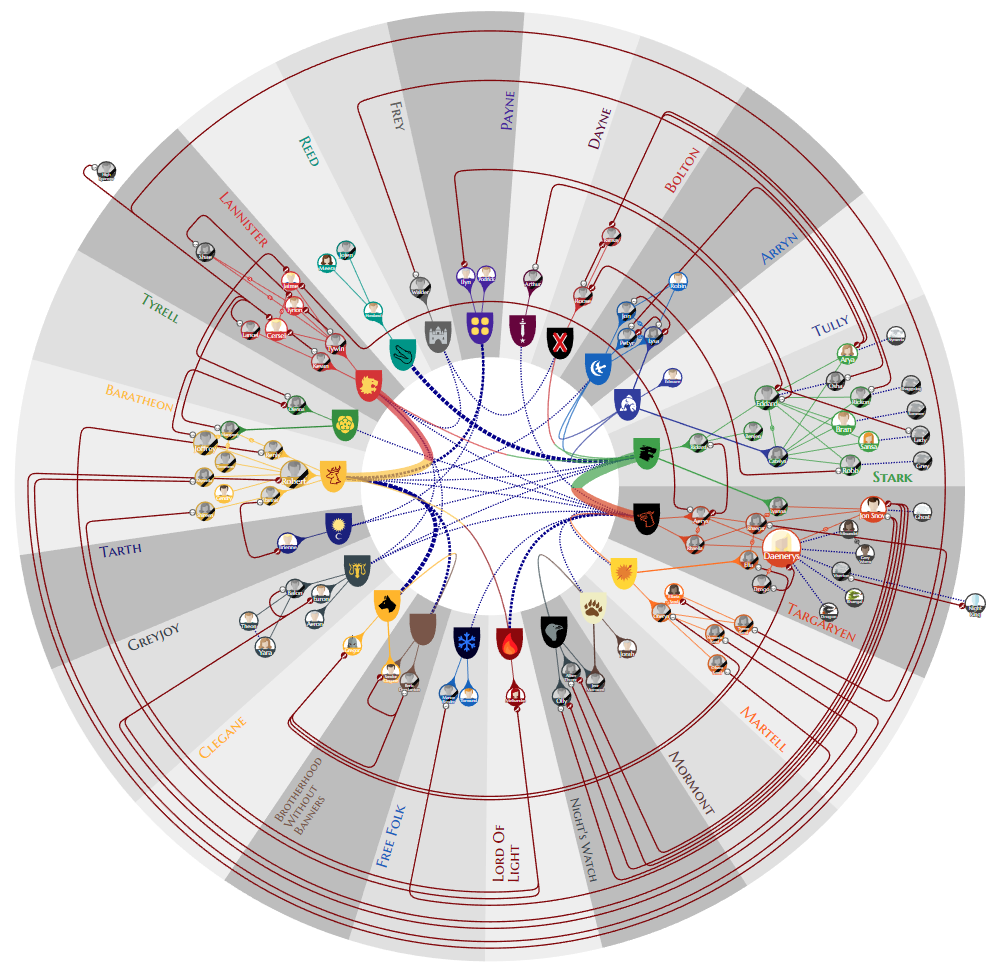
The committee likes the overall clarity of this drawing, and the use of symbols representing houses and individuals. It is a nice idea to use different drawing styles to visualize clusters of family relations, "peaceful" relations, and killings, allowing the viewer to focus on each of these as almost separate subgraphs. The visualization and an explanation of the drawing process is available online.
Evmorfia Argyriou: In our Game of Thrones visualization we grouped the characters according to their house and placed them on radial layers that depict generations. In each house, solid edges between characters show marriages, love interests and parenthood. Loyalty and family ties of characters of different houses are condensed into dotted and solid edges between the new house nodes in the central circle, while the blood-red edges on radial paths in the outskirts represent killings.
Creative Topics: Mathematics Genealogy
The Mathematics Genealogy Project is an initiative of the North Dakota State University to track all advisor-advisee relationships in the broader field of mathematics since the earliest records that are available. The database has 222,360 scientists on record as of today.
For the contest, we have selected the subgraph containing only the 2277 scientists who graduated before the year 1900, but retaining the number of descendants in the full graph. We also kept the year and country of each graduation.
We received 8 submissions for this category. We selected 3 winning submissions, which were printed on large poster boards and presented at the Graph Drawing Symposium. We will now first present the submissions that unfortunately did not make the top 3.

We will now present the top 3 submissions.
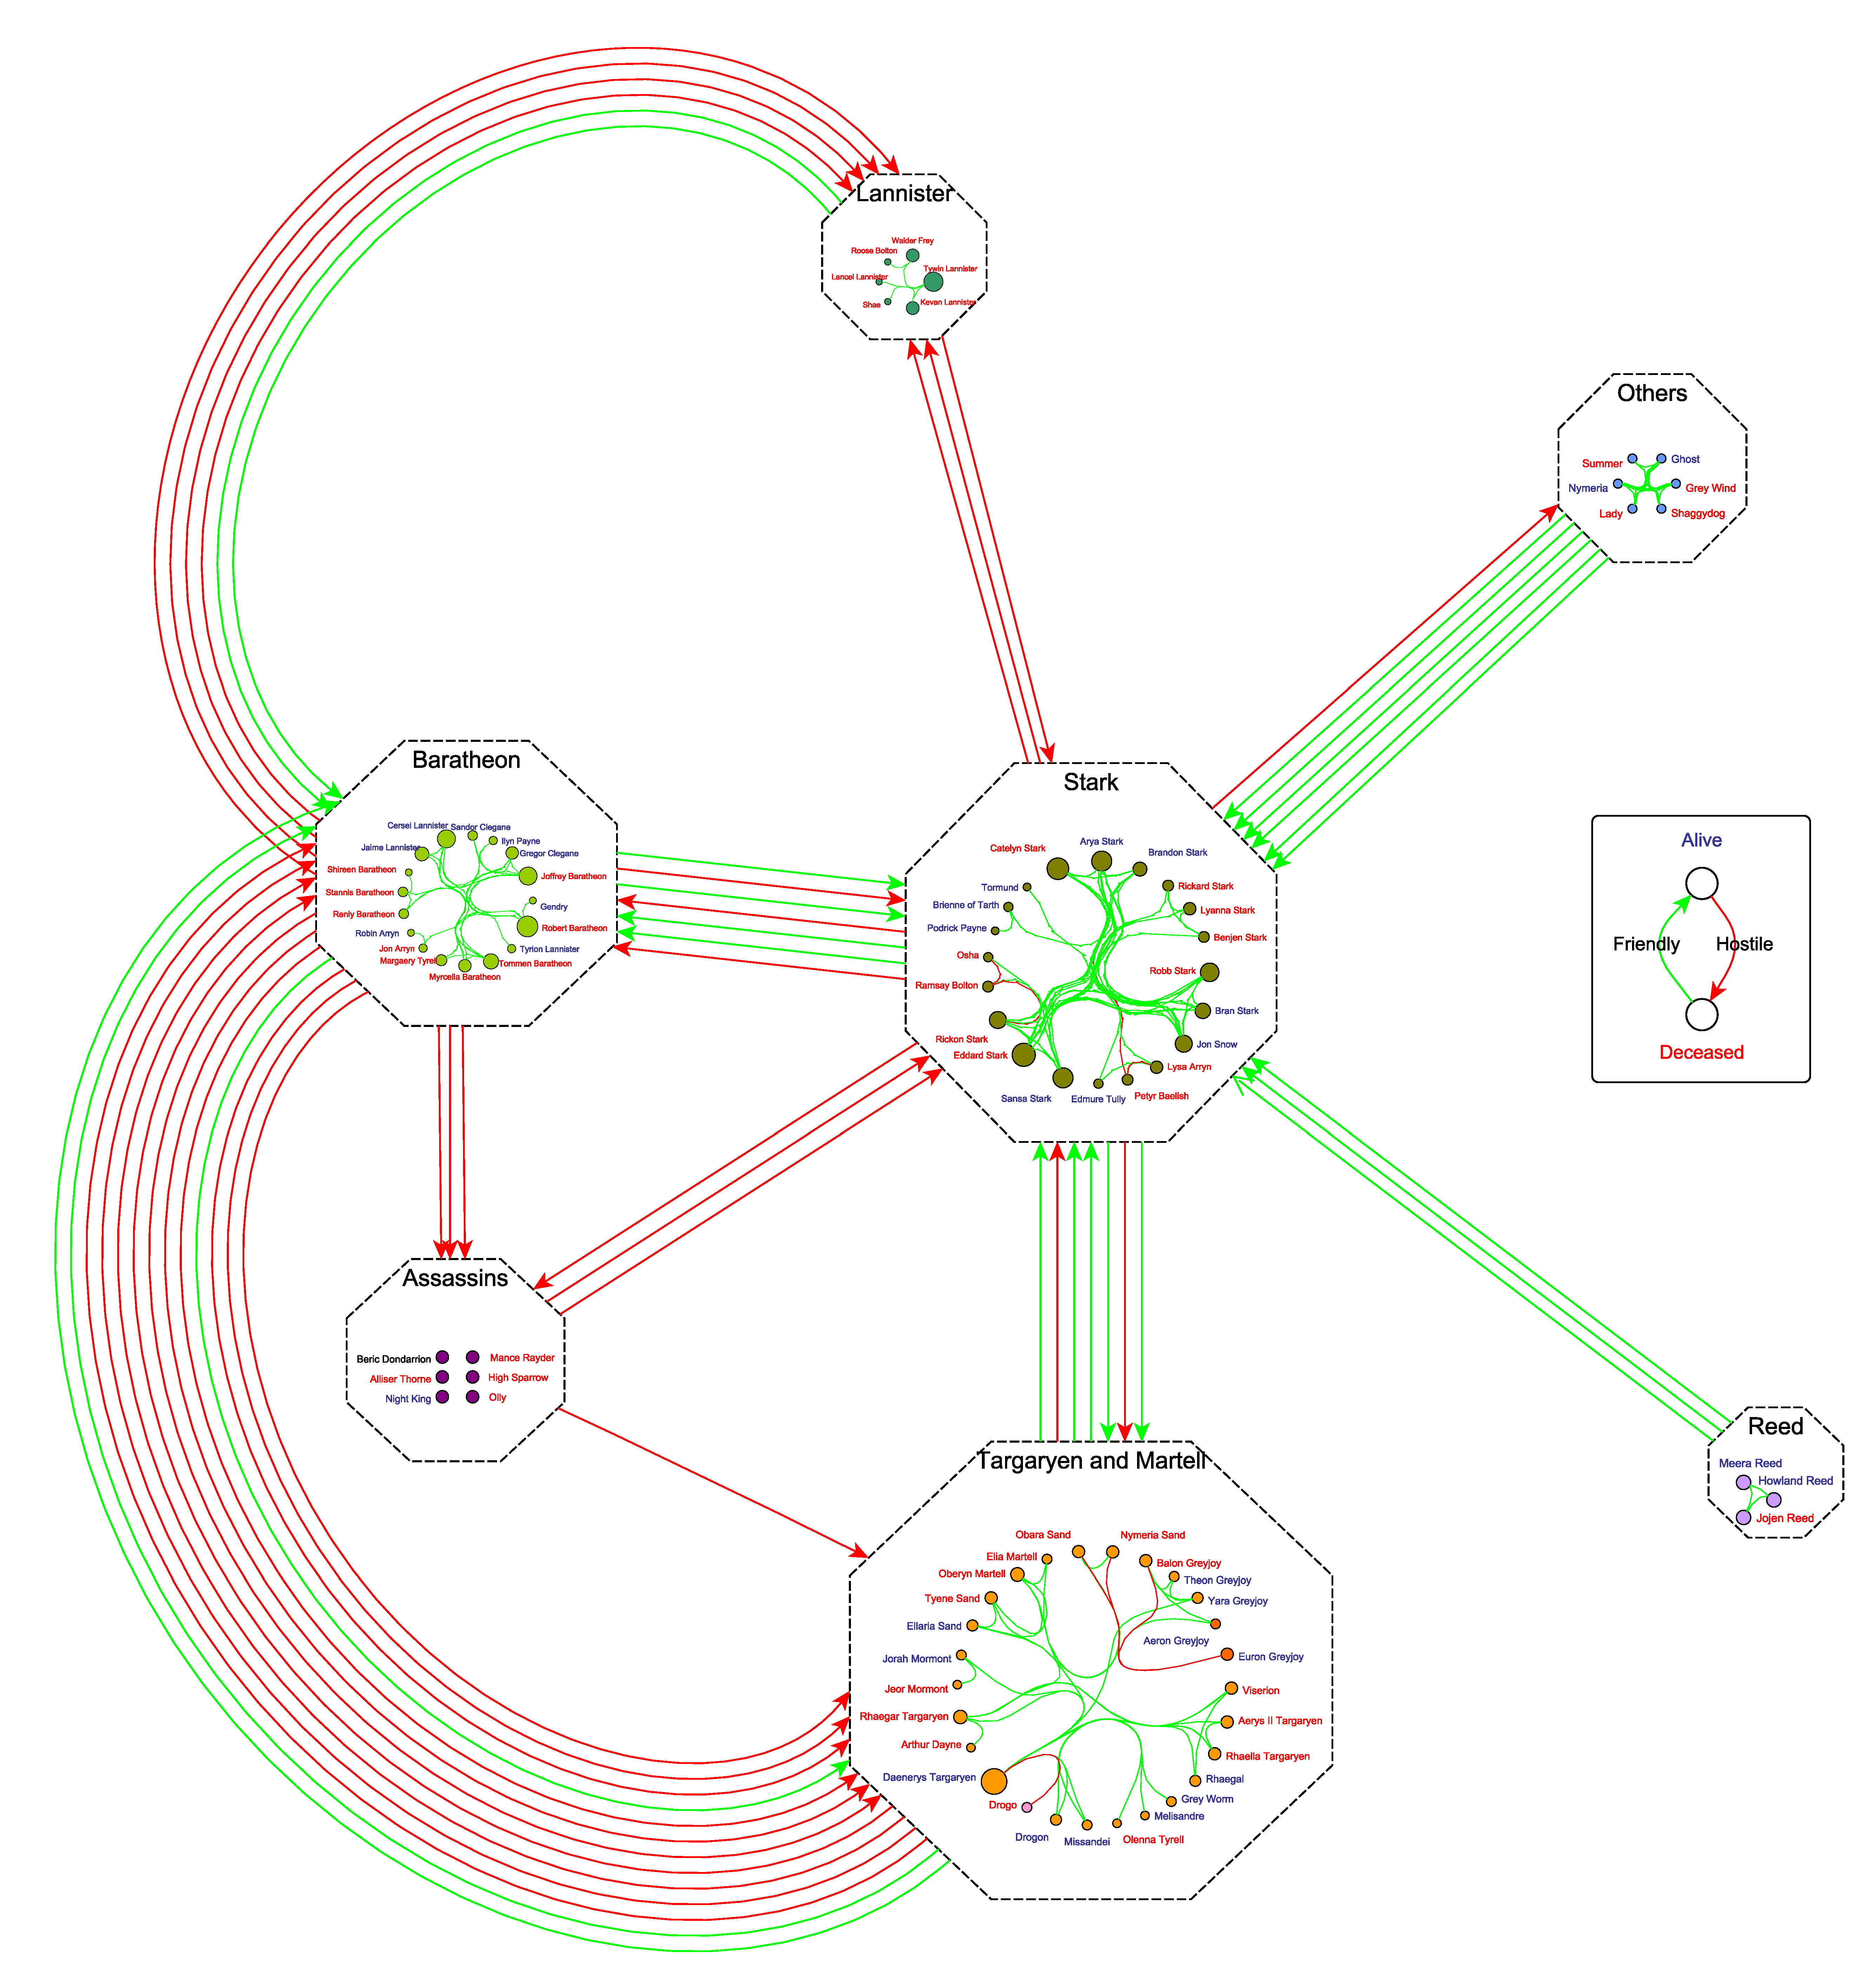
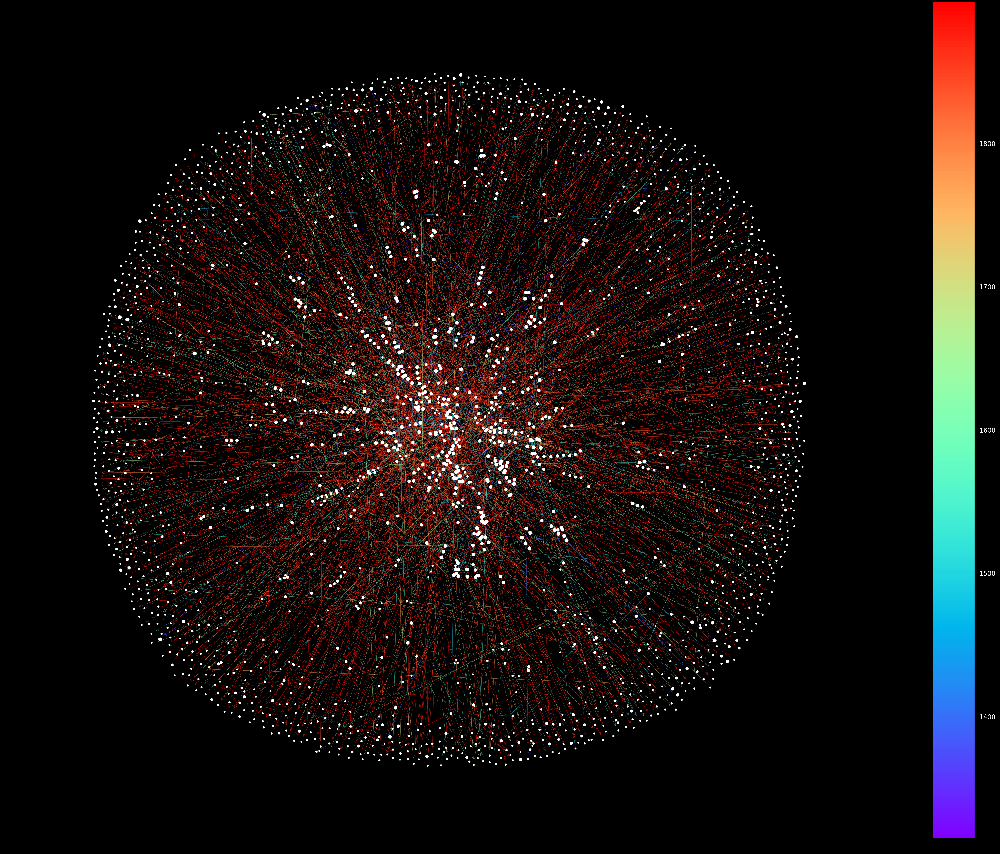
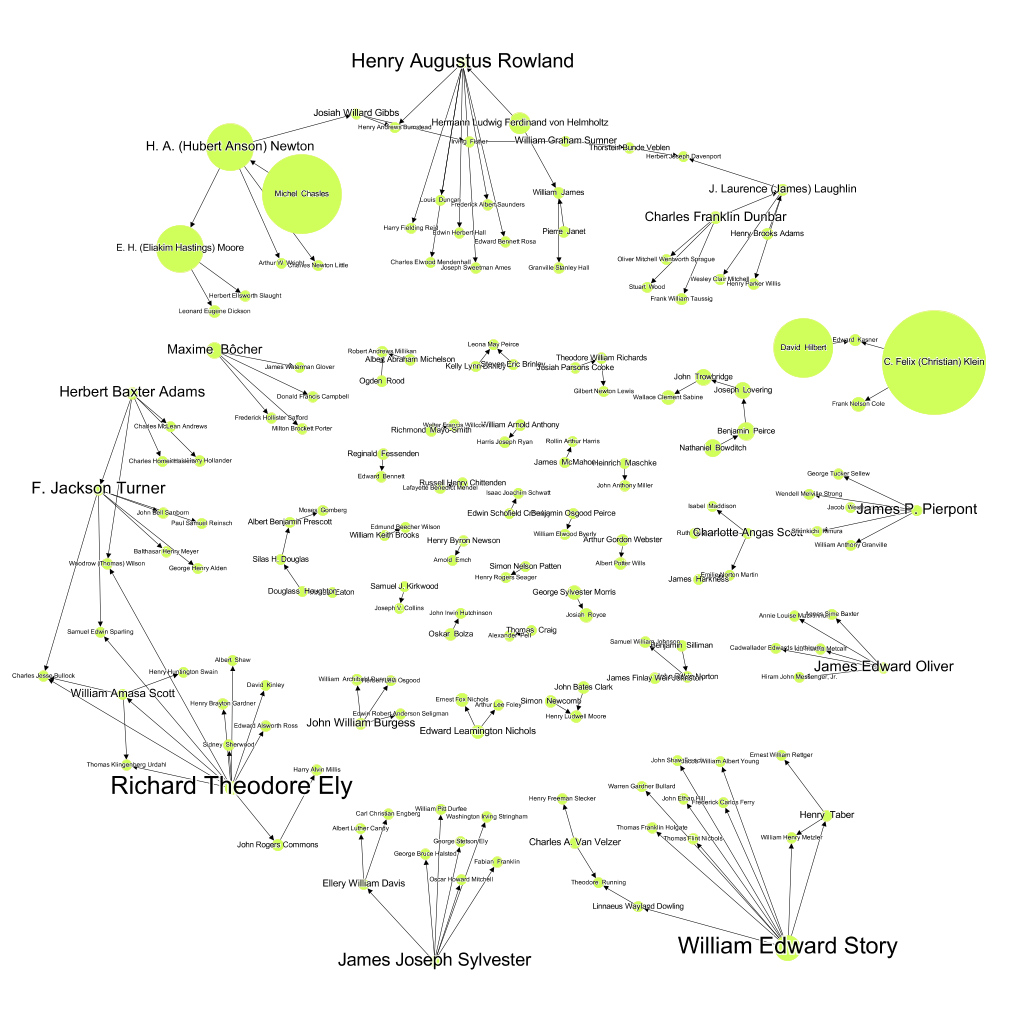
3rd Place:
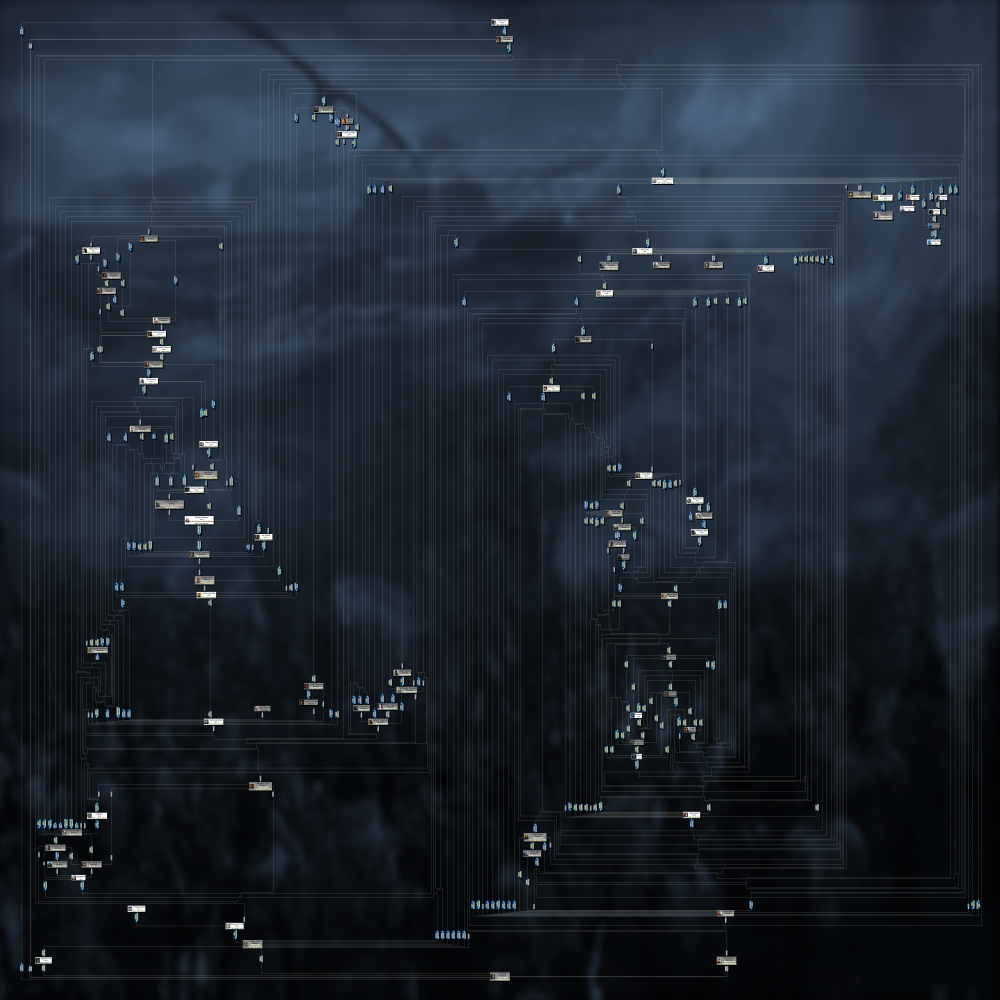
Yixuan Wang (University of Sydney)
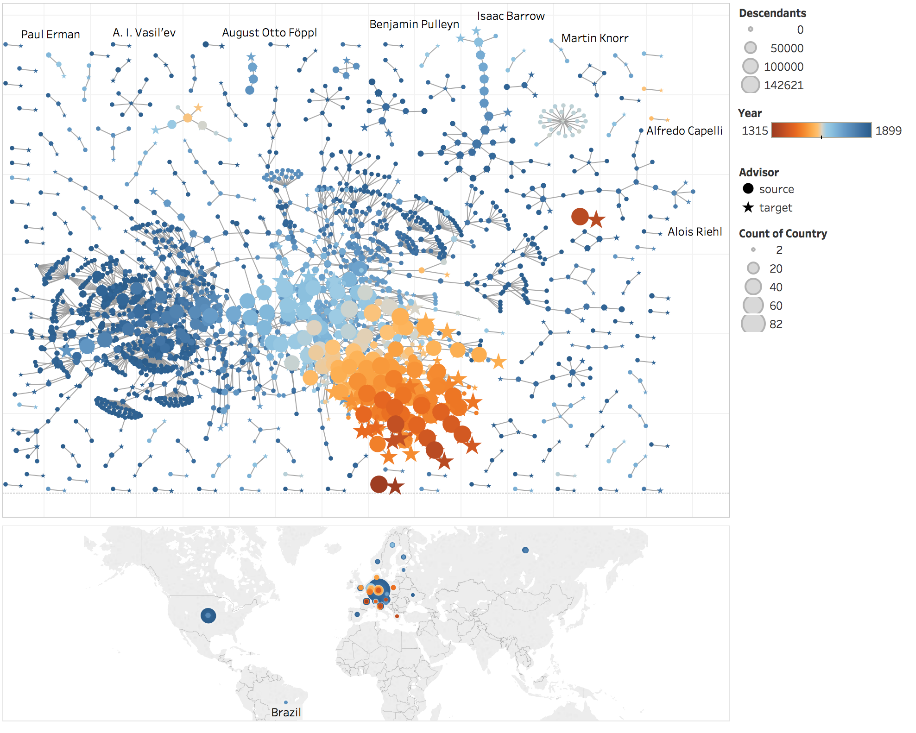
The committee really likes the idea of drawing this graph with approximately geo-located nodes, which allows the user to interpret vertex locations while still allowing sufficient freedom in the vertex placement to see the actual graph structure. The use of a color gradient for the year of graduation nicely complements this choice, as well as using vertex size to visualize the number of descendants.
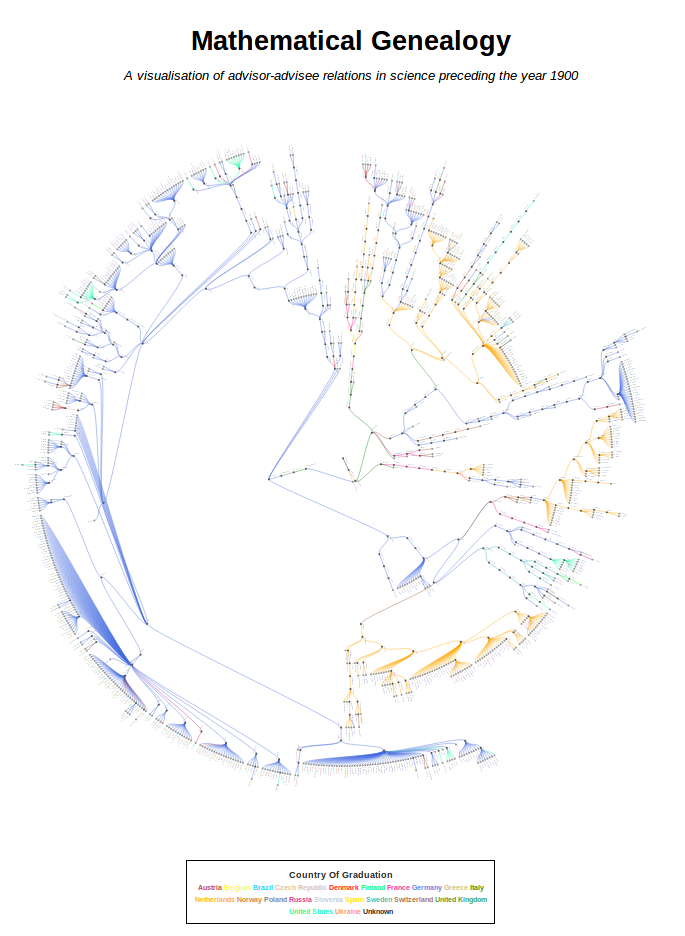
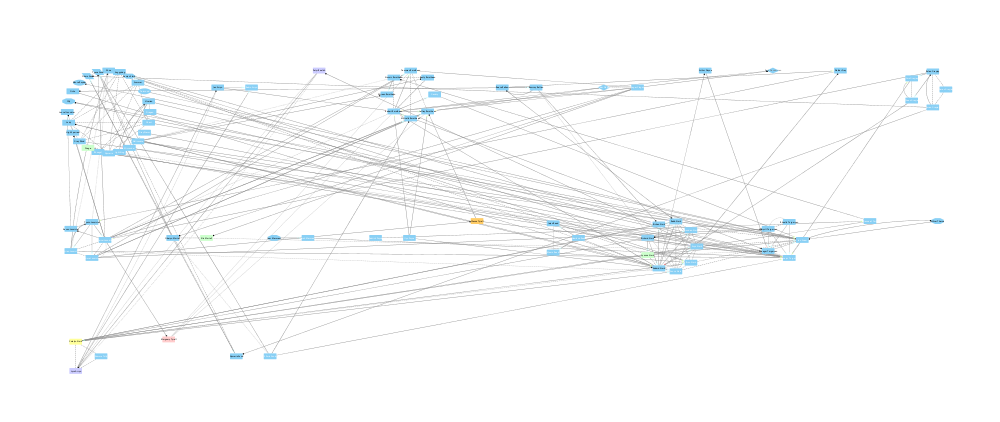
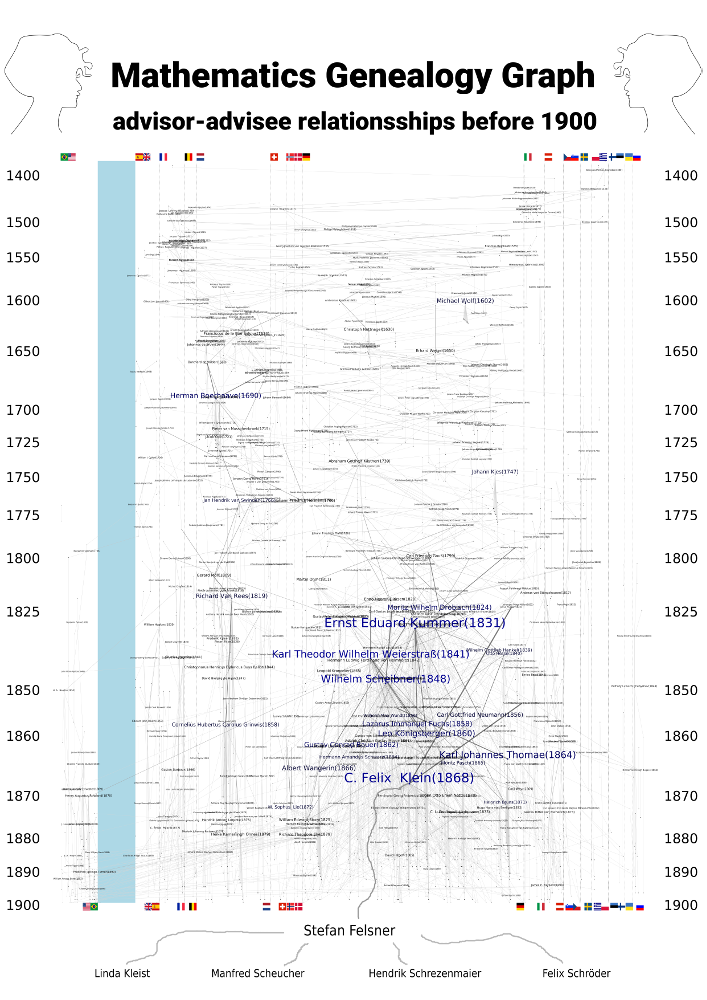
The committee was impressed by the clarity of this drawing, given the large data size and the authors' decision to include all individual names on a single poster. The use of large empty regions help the viewer to see the global graph structure at a glance, while individual clusters and relationships can still be distinguished.
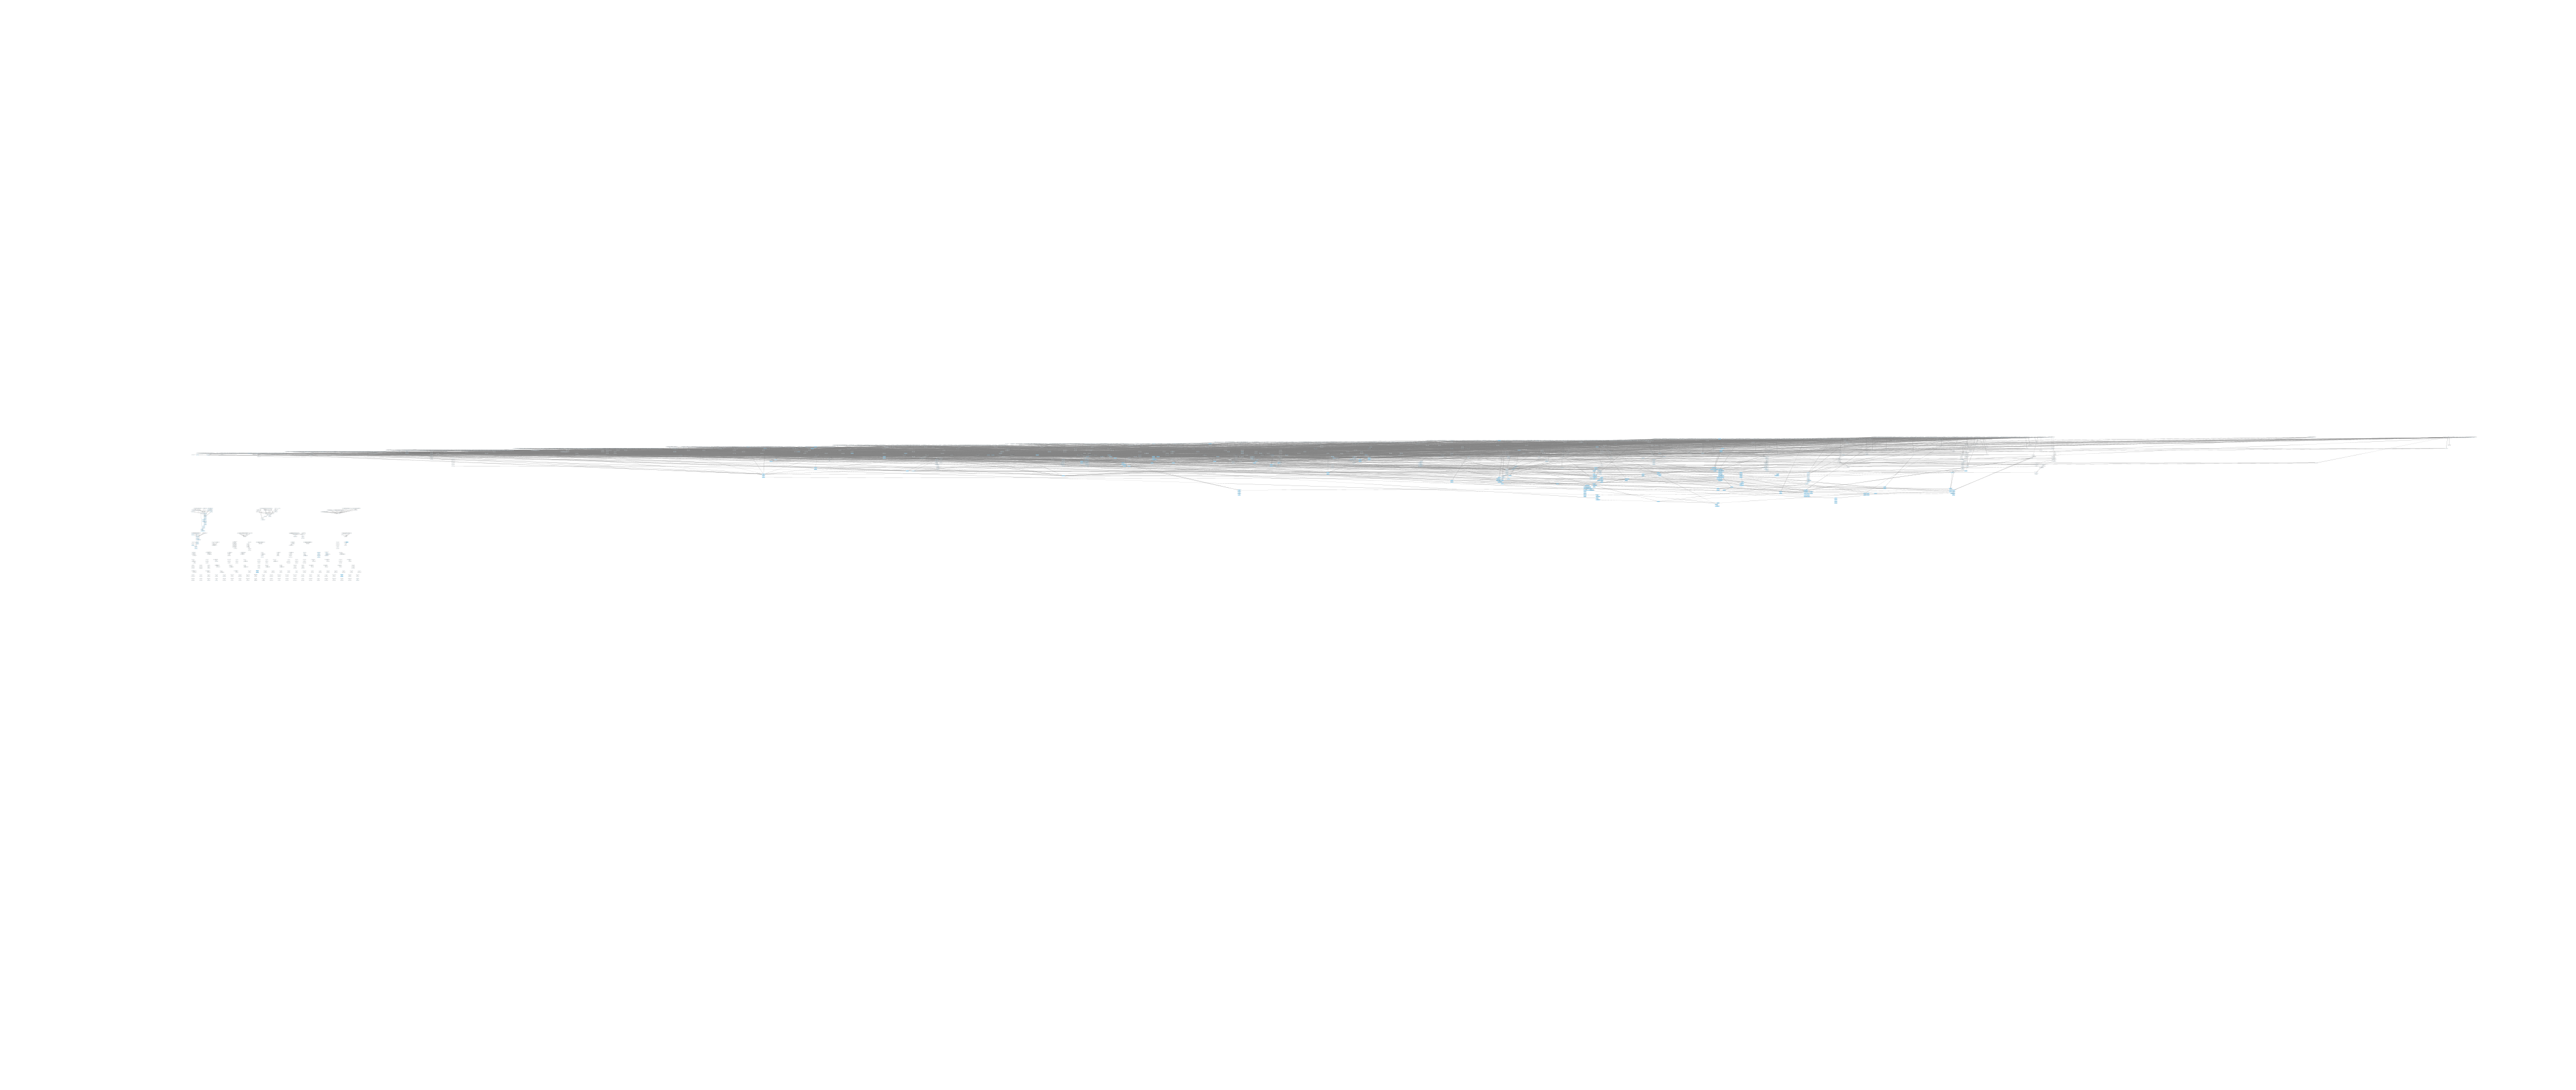
1st Place:
Florian Grötschla, Tamar Mirbach, Christian Ortlieb, Tamara Mchedlidze, and Marcel Radermacher (KIT)
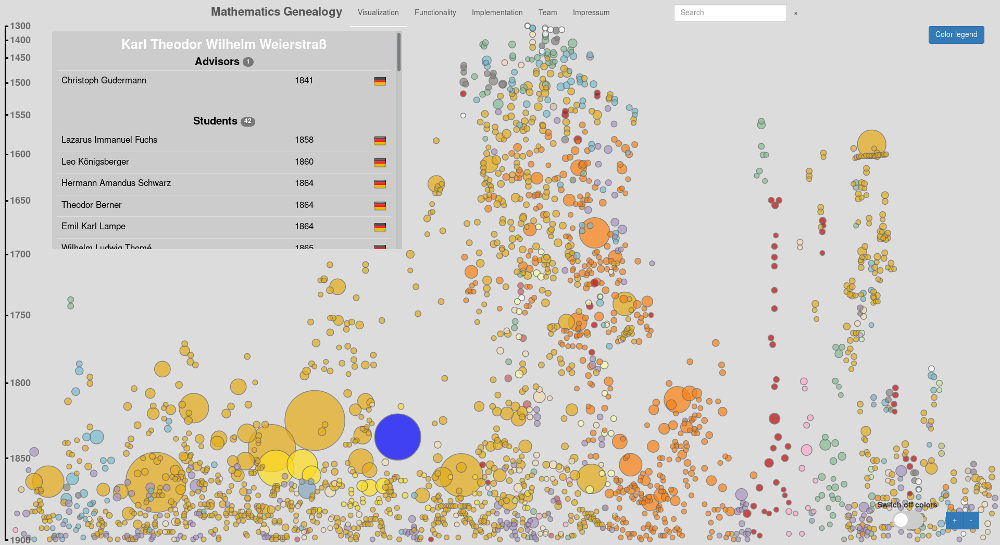
The committee was impressed by this interactive visualization. The website has some nice functionality; especially the highlighting of advisors and students and the additional information display on hovering over a node should be emphasized. This makes it a great way to explore the data. The drawing can be explored online.
Florian Grötschla: The large size of the genealogy graph, and the fact that it is denser than a tree, defeated our tries to create a readable standalone node-link diagram. Thus, we decided to avoid the display of the edges and instead design an interactive visualization tool where one can focus on smaller portions of the visualization using zooming operation, investigate the relations between mathematicians using an interactive highlight tool and still obtain a big picture of the data, which is enhanced by the coloring of the nodes according to the country of graduation. To keep the node proximity meaningful (connected nodes are close and non-connected far apart) and to express the time of graduation, we employed the Sugiyama framework for the node positions, where horizontal layers correspond to the graduation date.
Live Challenge: Manual Category
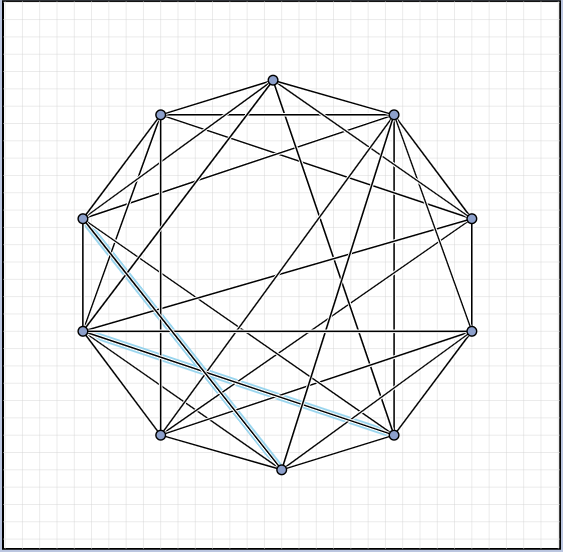
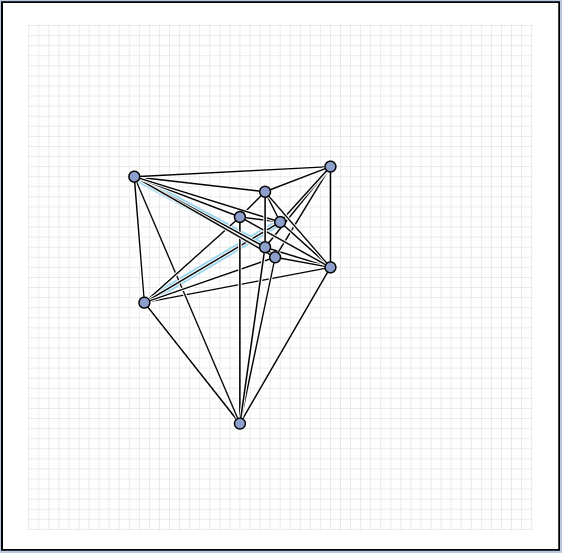
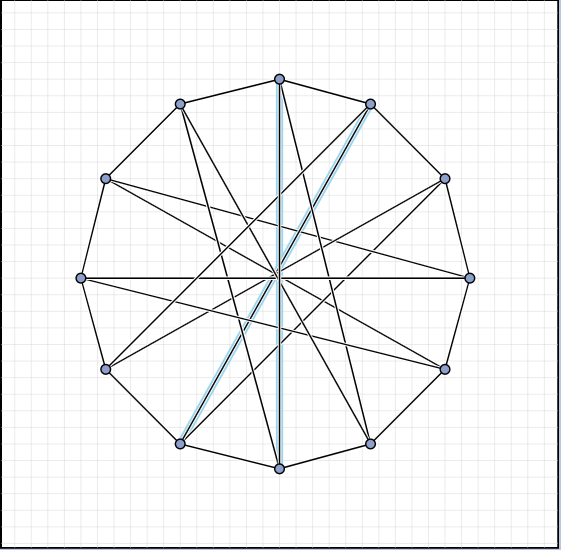
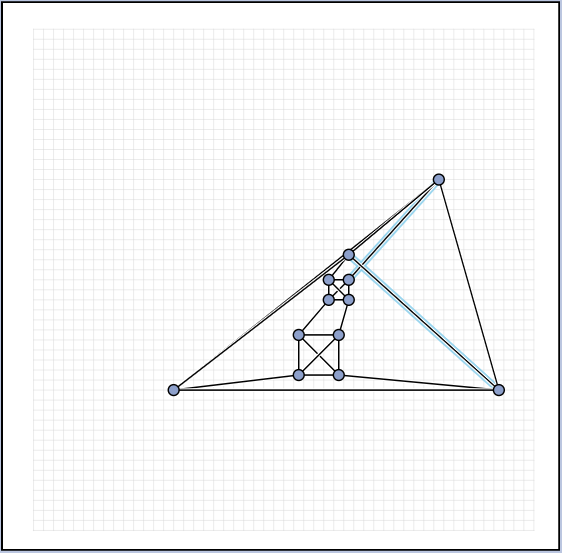
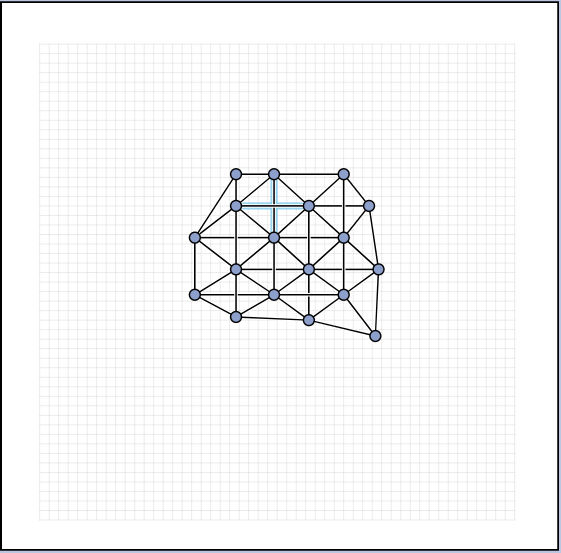
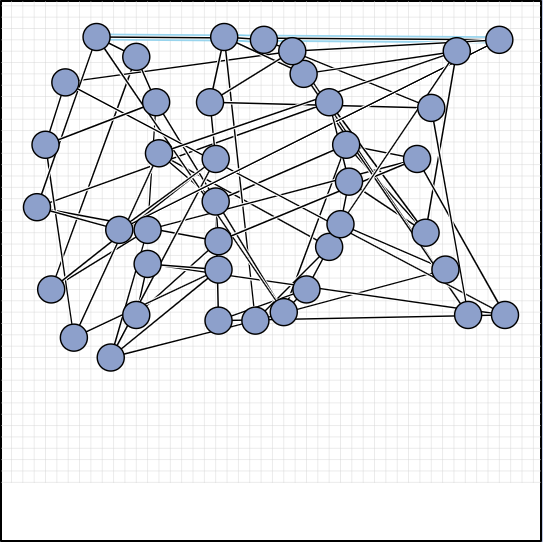
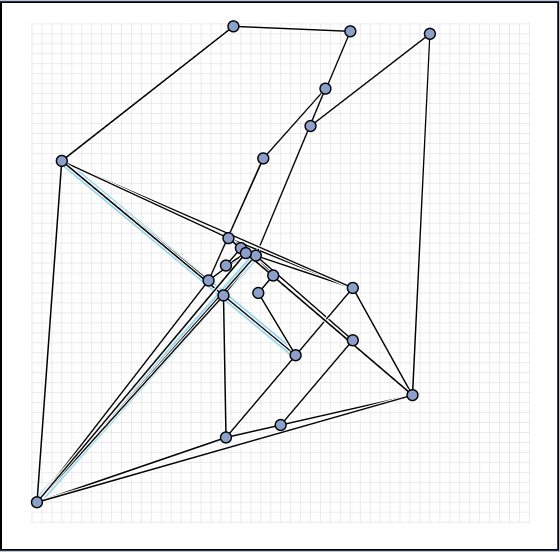
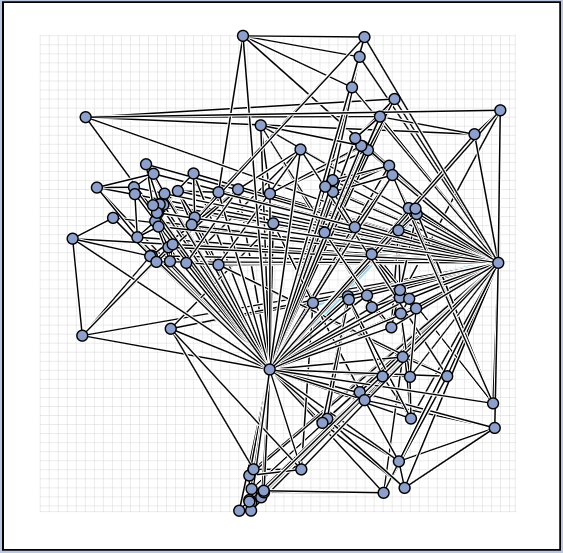
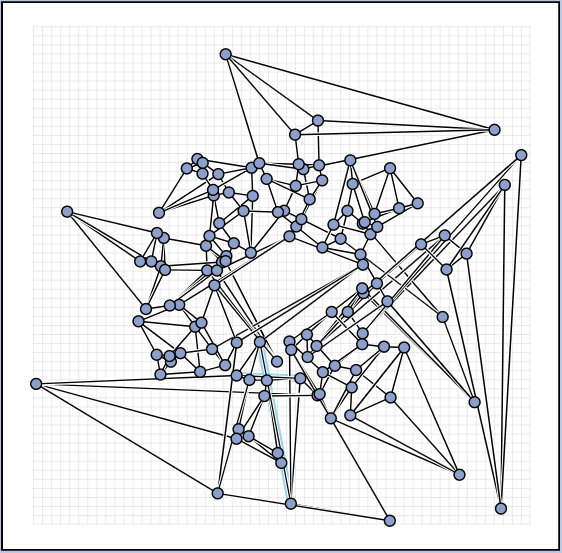
In the manual category, participants were presented with seven graphs. We present the input layouts and the best manual submitted solutions (click on the images to download the gdc files).
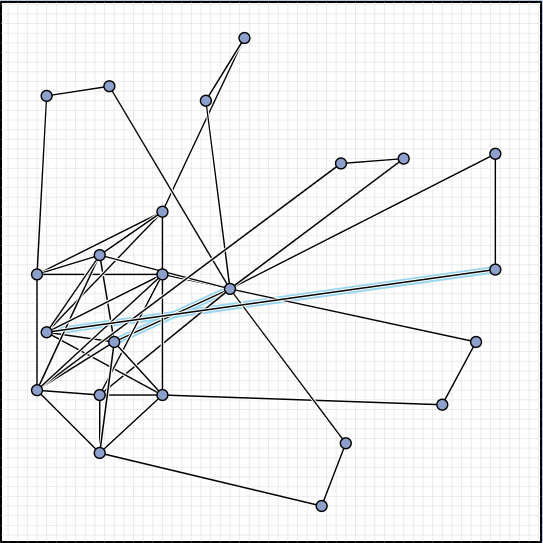
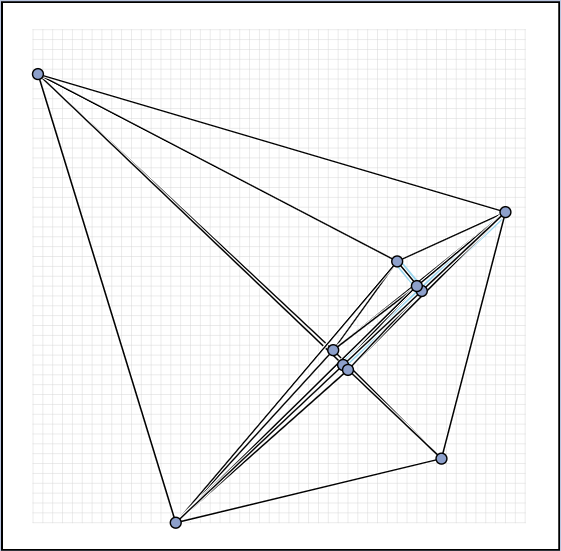
problem 1: input
|
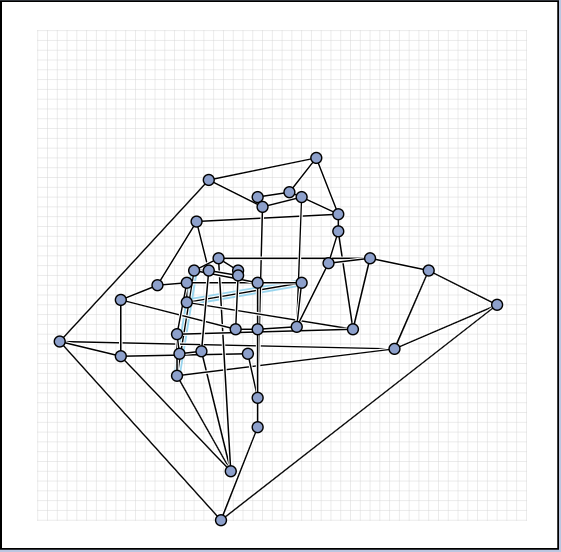
problem 1: best manual submission (Scho)
|
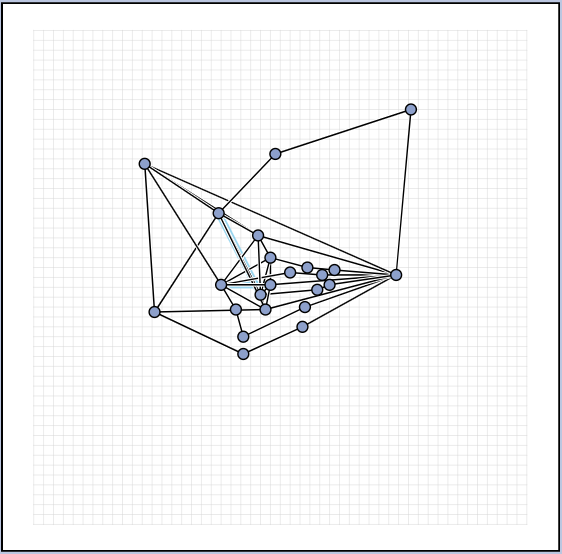
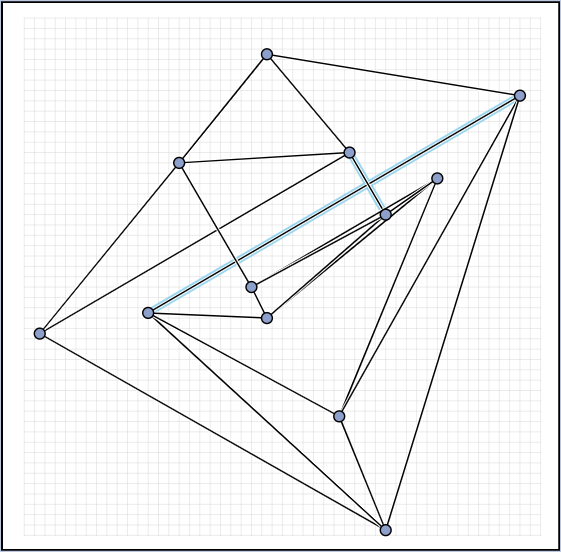
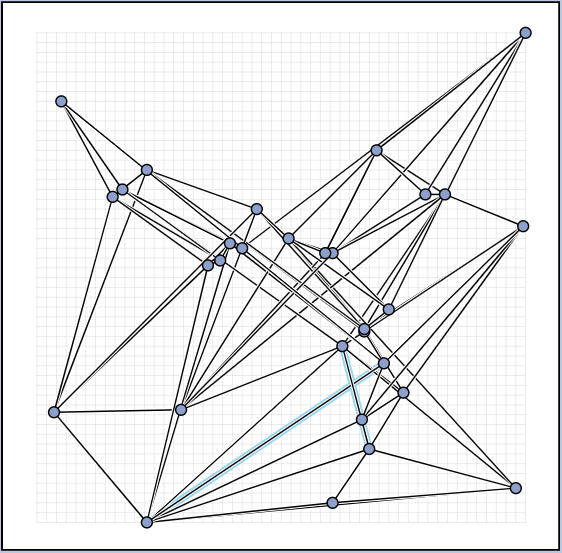
problem 2: input
|
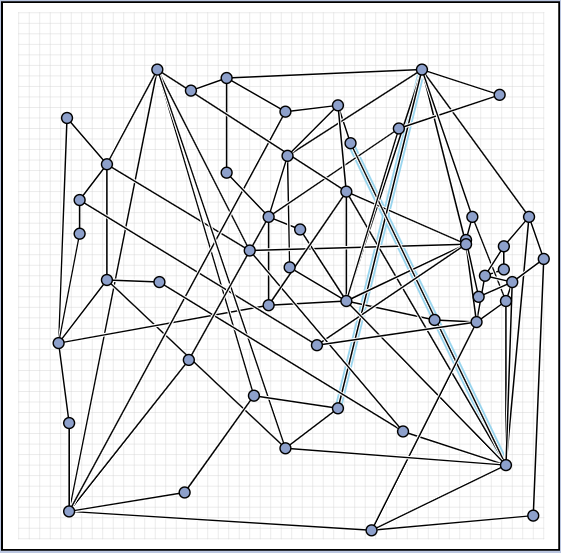
problem 2: best manual submission (Over-Aged)
|
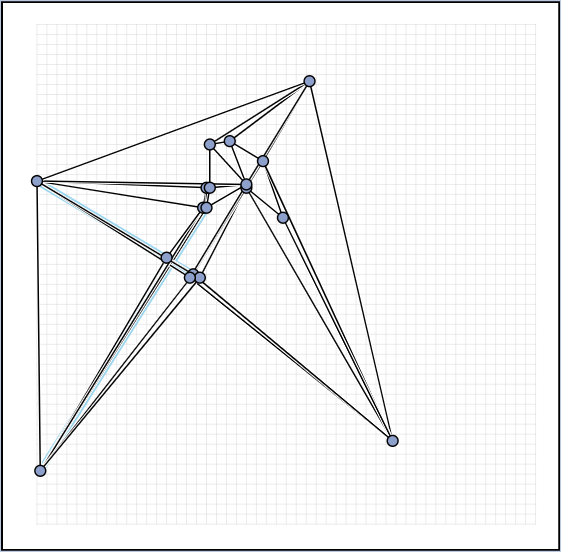
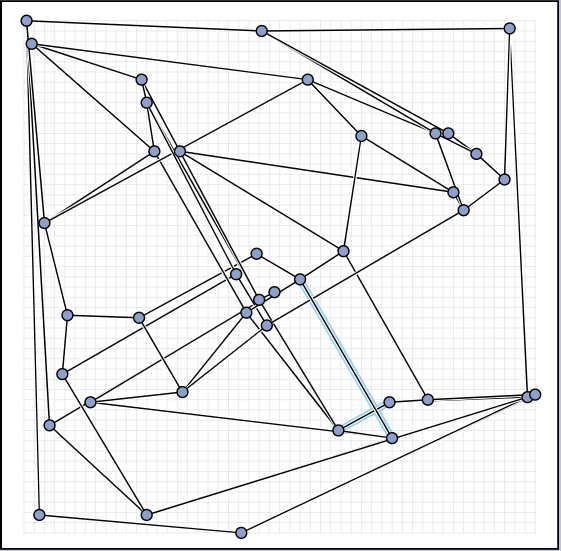
problem 3: input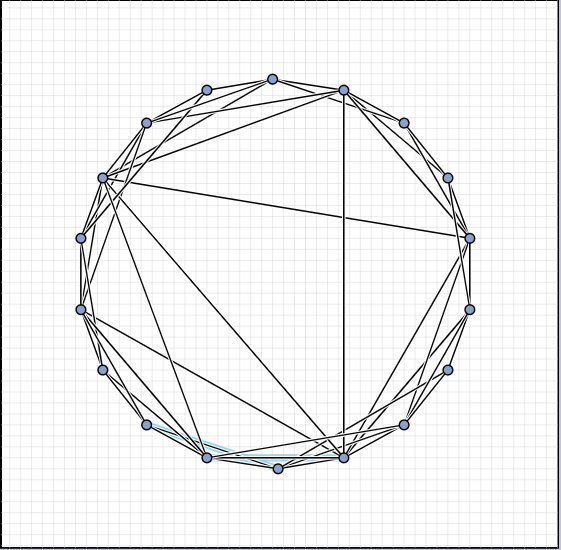
|
problem 3: best manual submission (ToBeDecided)
|
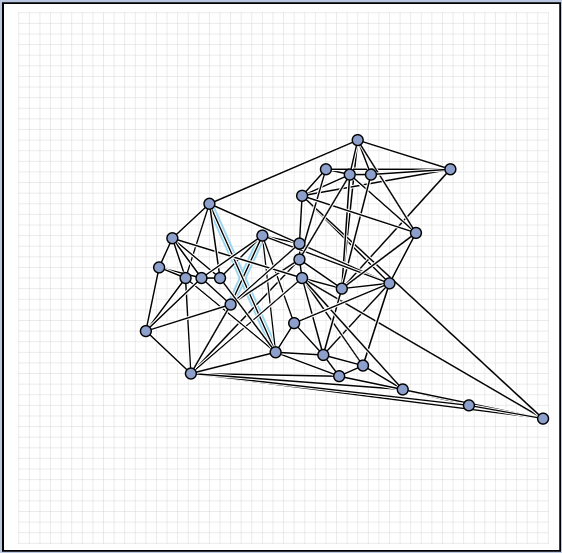
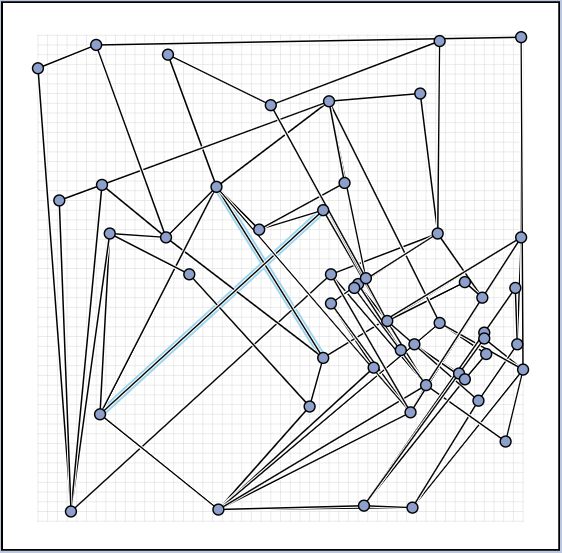
problem 4: input
|
problem 4: best manual submission (Scho)
|
problem 5: input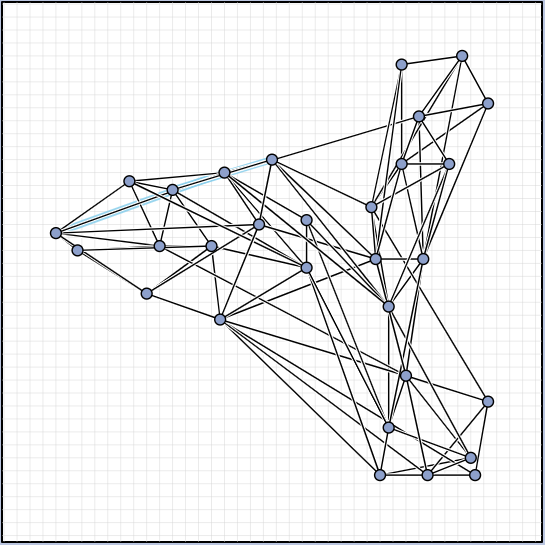
|
problem 5: best manual submission (NonAustriansAustrians)
|
problem 6: input
|
problem 6: best manual submission (Scho)
|
problem 7: input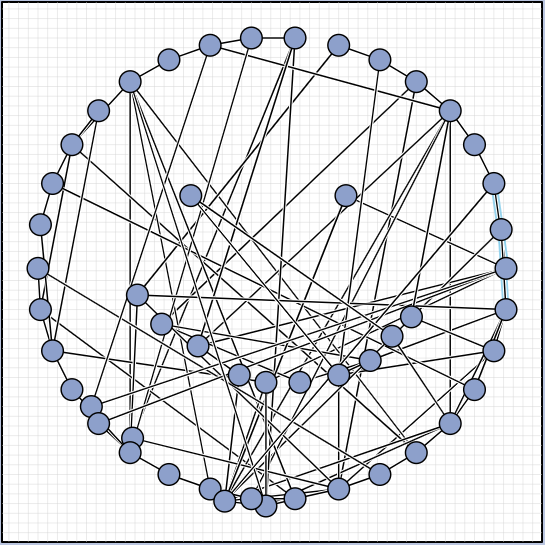
|
problem 7: best manual submission (RotesMinions)
|
We are happy to present the full list of scores for all teams. The numbers listed are the smallest crossing angle in degrees in each graph; the horizontal bars visualize the corresponding scores.
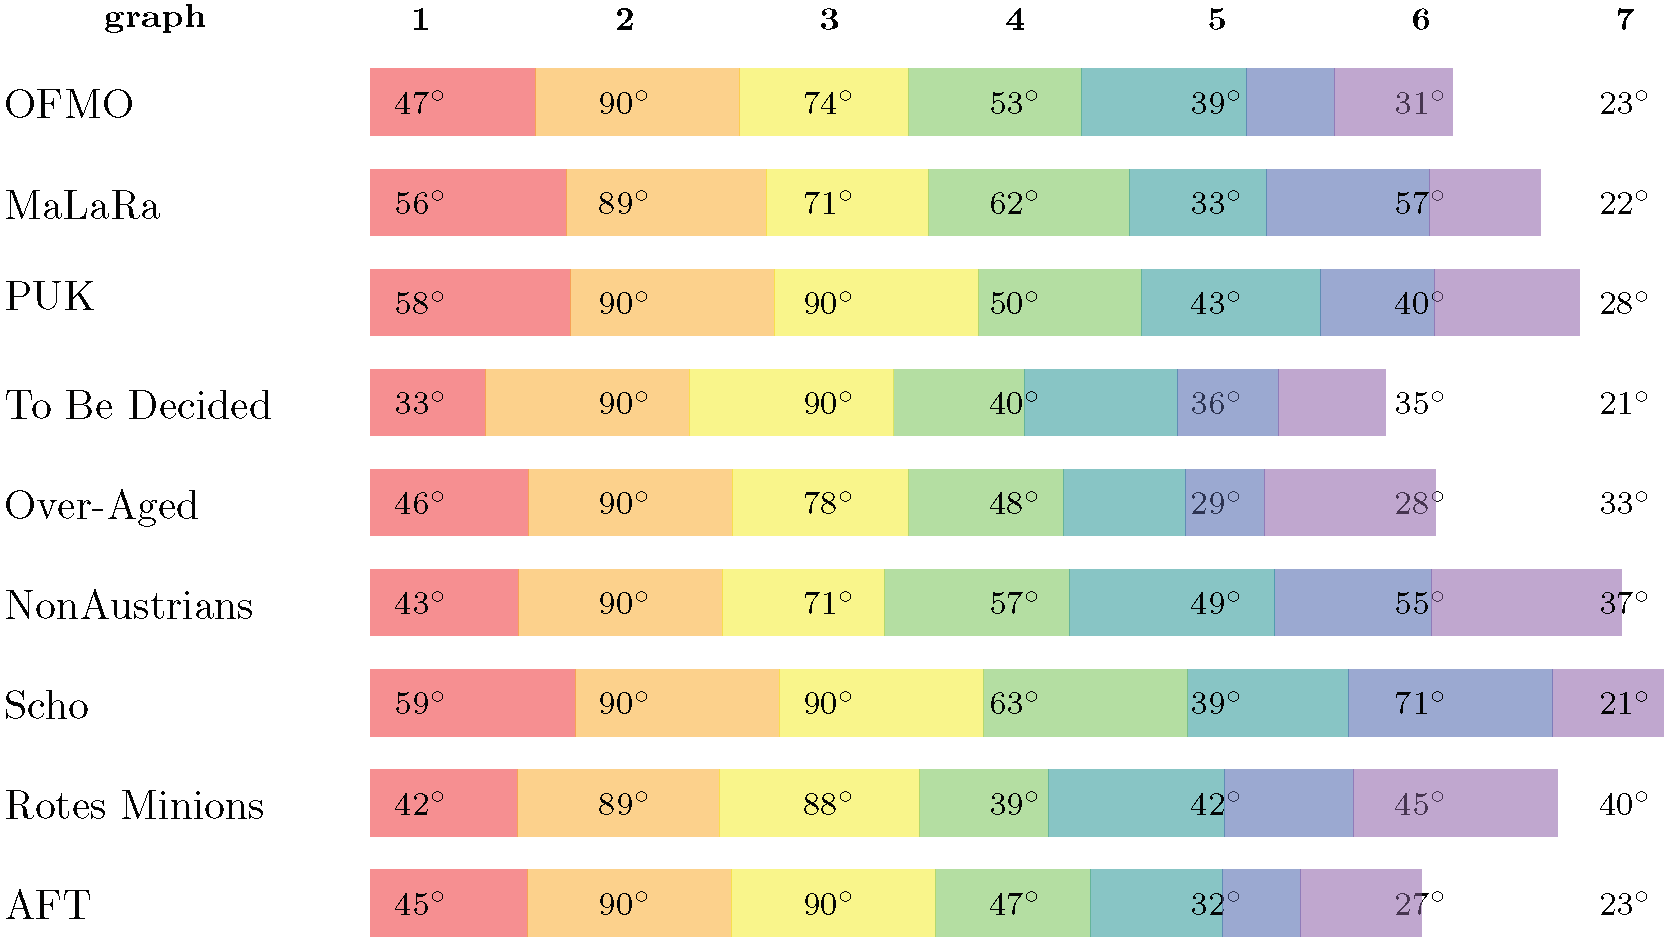
The third place team is team PUK, consisting of Paul Jungeblut (KIT), Jérôme Urhausen (University of Utrecht), and Peter Stumpf (University of Passau).
The second place team is team NonAustrians, consisting of Fabian Klute (TU Wien) and Irene Parada (TU Graz).
The winning team is team Scho, consisting of Myroslav Kryven and Johannes Zink (University of Würzburg)!
Johannes Zink: Our strategy was as follows: we started by trying to reduce the number of crossings (and thinning dense areas) as best as we could. While doing so we rather ignored the current worst angle. After this first phase, we were pursuing the seemingly obvious strategy of iteratively improving the current worst crossing angle locally. In one of the given instances, we were also trying to orient all edges either horizontally or vertically such that the crossings occurred only between these types of edges. Besides competing against strong and experienced other teams, we faced another tough opponent: the time. Since we spent much of it on the first graphs, we had to give up our aforementioned strategy towards the end. On the last graph, we had only spent a few moments to improve the worst angles locally before we submitted it some seconds before the end of the time. In spite of this last bad result, it turned out that we managed to keep our lead barely. Finally, if you are wondering about our team name it is both the Ukrainian word for "what?" and the Franconian-German word for "indeed".
Live Challenge: Automatic Category
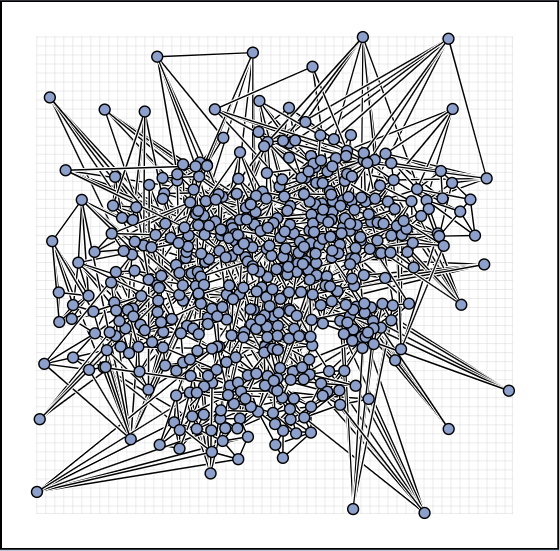
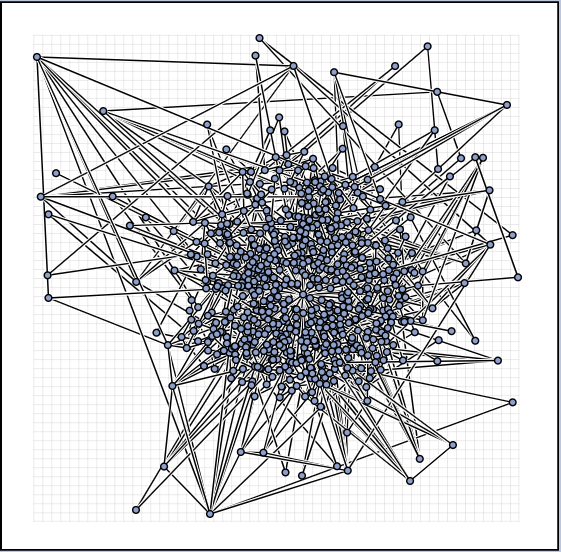
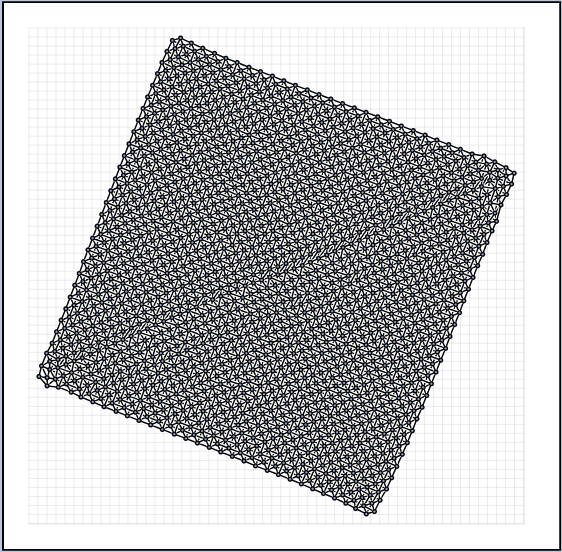
In the automatic category, the same seven graphs as in the manual category had to be solved, and in addition another set of seven larger graphs.
problem 1: best automatic submission (TübingenColdShower)
|
problem 2: best automatic submission (TübingenColdShower)
|
problem 3: best automatic submission (TübingenColdShower)
|
problem 4: best automatic submission (TübingenColdShower)
|
problem 5: best automatic submission (TübingenColdShower)
|
problem 6: best automatic submission (TübingenColdShower)
|
problem 7: best automatic submission (TübingenColdShower)
|
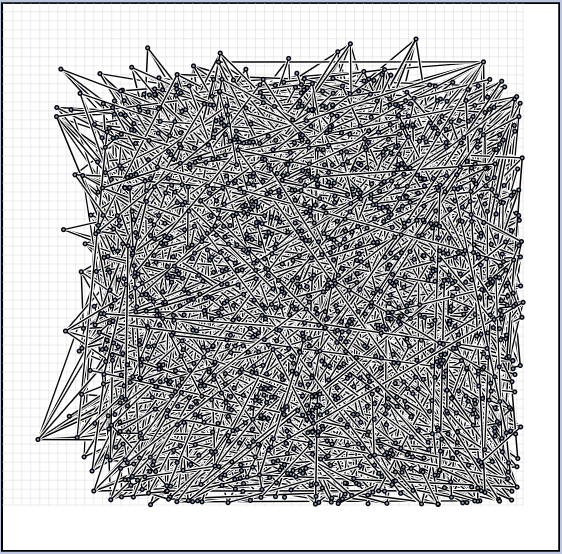
problem 8: best automatic submission (TübingenColdShower)
|
problem 9: best automatic submission (TübingenColdShower)
|
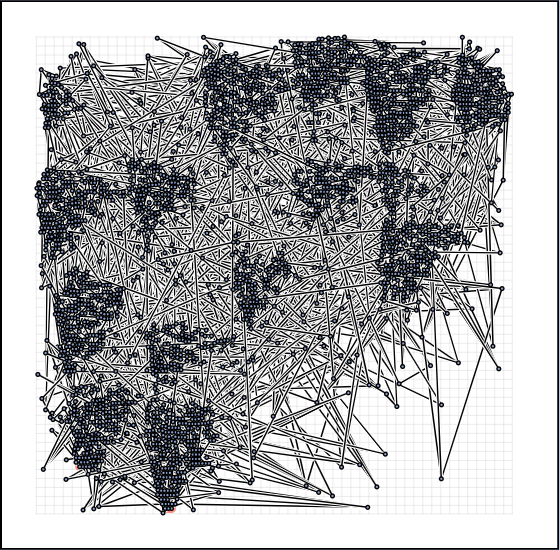
problem 10: best automatic submission (CoffeeVM+)
|
problem 11: best automatic submission (CoffeeVM+)
|
problem 12: best automatic submission (TübingenColdShower)
|
problem 13: best automatic submission (CoffeeVM+)
|
problem 14: best automatic submission (TübingenColdShower)
|
Again, we are happy to present the full list of scores for all teams. The numbers listed are the smallest crossing angle in degrees in each graph; the horizontal bars visualize the corresponding scores.
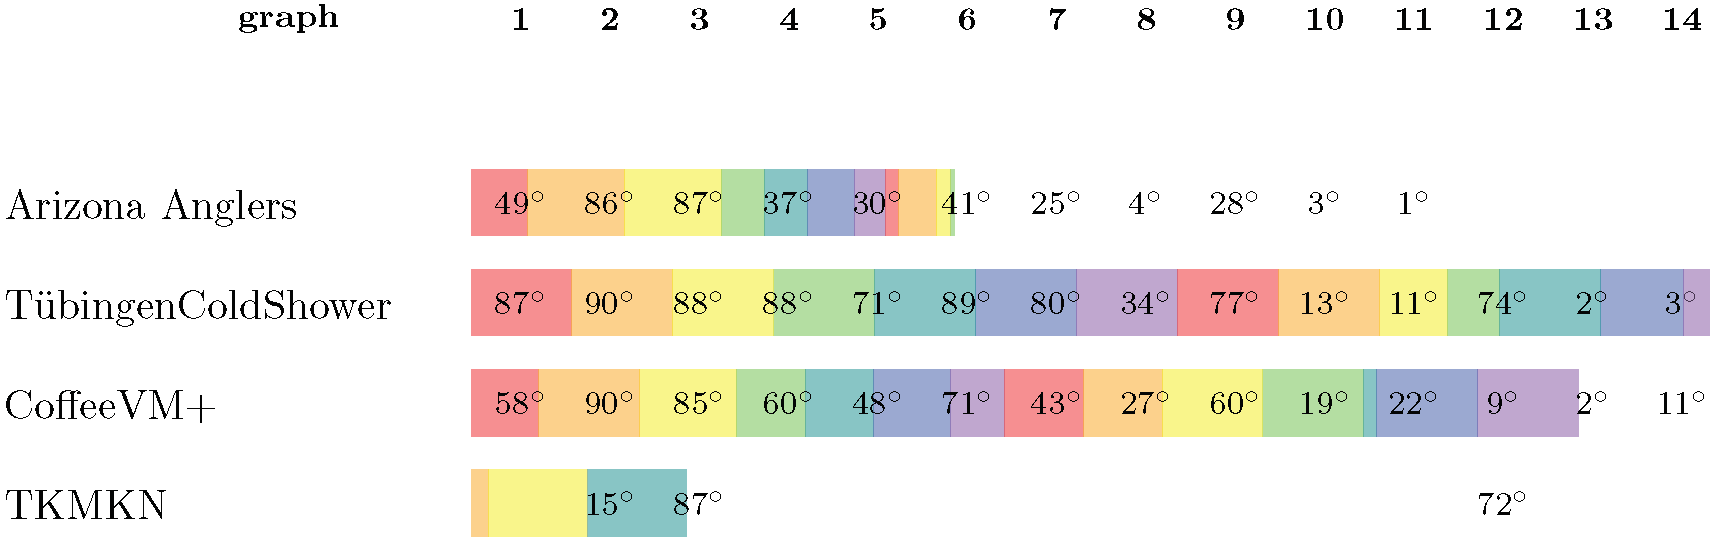
The third place team is team Arizona Anglers, consisting of Reyan Ahmed and Sabin Devkota (University of Arizona).
The second place team is team CoffeeVM+, consisting of Almut Demel, Dominik Dürrschnabel, Lasse Wulf, Tamara Mchedlidze, and Marcel Radermacher (KIT).
The winning team is team TübingenColdShower, consisting of Amadäus Spallek, Christian Geckeler, Henry Förster, and Michalis Bekos (University of Tübingen)!
Christian Geckeler: After our last year's failure on the exact same topic, we decided to completely change our approach to become more competitive. It turned out that our new probabilistic hill climbing approach performed way better than our previous force-directed algorithm, and thus the result for the TübingenColdShower team was not of the same kind as the water in the shower earlier the same day.